

Question: answer 1-3 (have posted copyable format of file) Initial Week 1 Week 2 Week 3 Week 4 Week 5 Week 6 Week 7 Week 8
answer 1-3
(have posted copyable format of file)
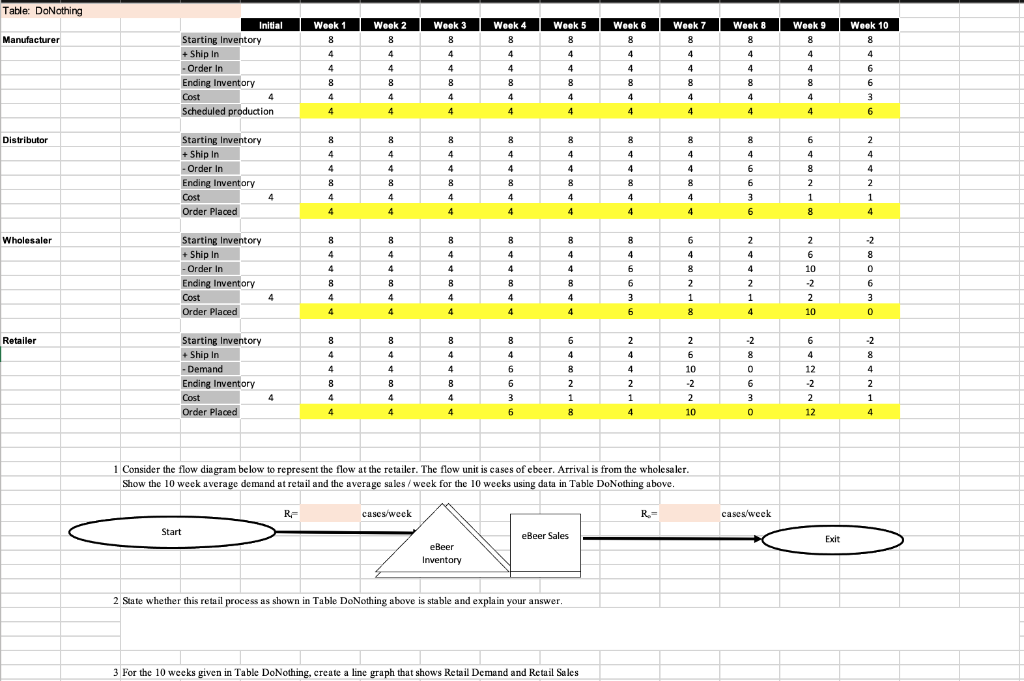
| Initial | Week 1 | Week 2 | Week 3 | Week 4 | Week 5 | Week 6 | Week 7 | Week 8 | Week 9 | Week 10 | ||||
| Manufacturer | Starting Inventory | 8 | 8 | 8 | 8 | 8 | 8 | 8 | 8 | 8 | 8 | |||
| + Ship In | 4 | 4 | 4 | 4 | 4 | 4 | 4 | 4 | 4 | 4 | ||||
| - Order In | 4 | 4 | 4 | 4 | 4 | 4 | 4 | 4 | 4 | 6 | ||||
| Ending Inventory | 8 | 8 | 8 | 8 | 8 | 8 | 8 | 8 | 8 | 6 | ||||
| Cost | 4 | 4 | 4 | 4 | 4 | 4 | 4 | 4 | 4 | 4 | 3 | |||
| Scheduled production | 4 | 4 | 4 | 4 | 4 | 4 | 4 | 4 | 4 | 6 | ||||
| Distributor | Starting Inventory | 8 | 8 | 8 | 8 | 8 | 8 | 8 | 8 | 6 | 2 | |||
| + Ship In | 4 | 4 | 4 | 4 | 4 | 4 | 4 | 4 | 4 | 4 | ||||
| - Order In | 4 | 4 | 4 | 4 | 4 | 4 | 4 | 6 | 8 | 4 | ||||
| Ending Inventory | 8 | 8 | 8 | 8 | 8 | 8 | 8 | 6 | 2 | 2 | ||||
| Cost | 4 | 4 | 4 | 4 | 4 | 4 | 4 | 4 | 3 | 1 | 1 | |||
| Order Placed | 4 | 4 | 4 | 4 | 4 | 4 | 4 | 6 | 8 | 4 | ||||
| Wholesaler | Starting Inventory | 8 | 8 | 8 | 8 | 8 | 8 | 6 | 2 | 2 | -2 | |||
| + Ship In | 4 | 4 | 4 | 4 | 4 | 4 | 4 | 4 | 6 | 8 | ||||
| - Order In | 4 | 4 | 4 | 4 | 4 | 6 | 8 | 4 | 10 | 0 | ||||
| Ending Inventory | 8 | 8 | 8 | 8 | 8 | 6 | 2 | 2 | -2 | 6 | ||||
| Cost | 4 | 4 | 4 | 4 | 4 | 4 | 3 | 1 | 1 | 2 | 3 | |||
| Order Placed | 4 | 4 | 4 | 4 | 4 | 6 | 8 | 4 | 10 | 0 | ||||
| Retailer | Starting Inventory | 8 | 8 | 8 | 8 | 6 | 2 | 2 | -2 | 6 | -2 | |||
| + Ship In | 4 | 4 | 4 | 4 | 4 | 4 | 6 | 8 | 4 | 8 | ||||
| - Demand | 4 | 4 | 4 | 6 | 8 | 4 | 10 | 0 | 12 | 4 | ||||
| Ending Inventory | 8 | 8 | 8 | 6 | 2 | 2 | -2 | 6 | -2 | 2 | ||||
| Cost | 4 | 4 | 4 | 4 | 3 | 1 | 1 | 2 | 3 | 2 | 1 | |||
| Order Placed | 4 | 4 | 4 | 6 | 8 | 4 | 10 | 0 | 12 | 4 | ||||
Step by Step Solution
There are 3 Steps involved in it
1 Expert Approved Answer
Step: 1 Unlock

Question Has Been Solved by an Expert!
Get step-by-step solutions from verified subject matter experts
Step: 2 Unlock
Step: 3 Unlock