

Question: Answer 1-3 plz 91 1-4 92 - 8 r (cm) 12 ( m?) FE (N) 10 0.01 28.76 9 0.0081 35.506 8 0.0064 44.938 7
Answer 1-3 plz
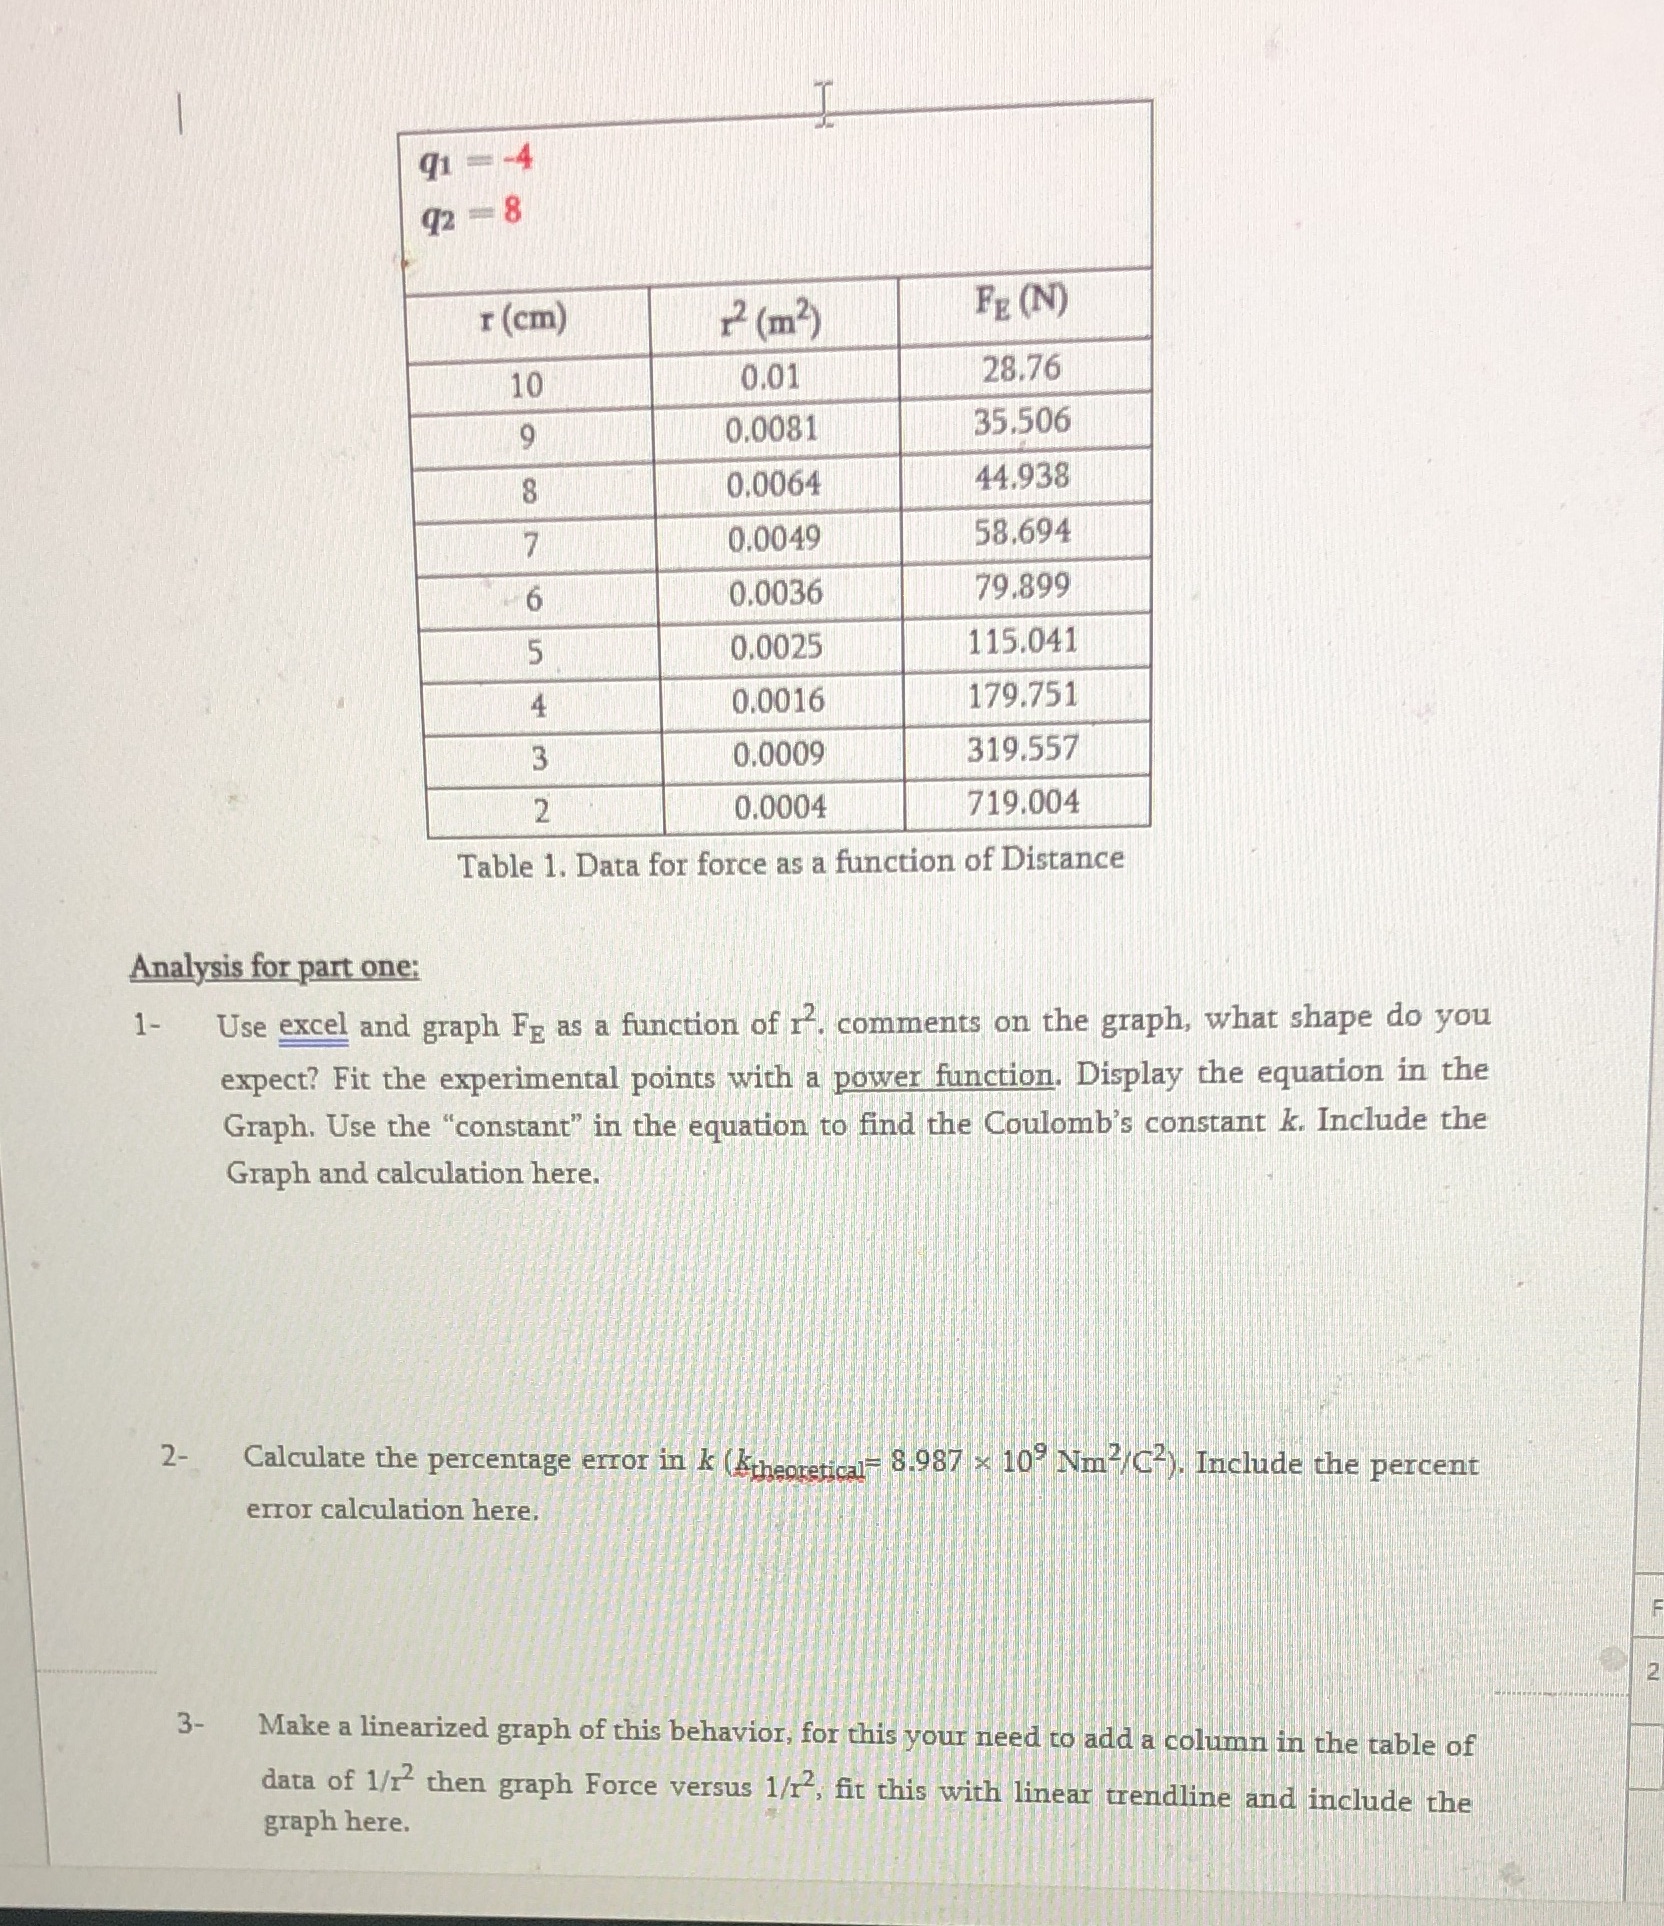
91 1-4 92 - 8 r (cm) 12 ( m?) FE (N) 10 0.01 28.76 9 0.0081 35.506 8 0.0064 44.938 7 0.0049 58.694 6 0.0036 79.899 5 0.0025 115.041 0.0016 179.751 0.0009 319.557 2 0.0004 719.004 Table 1. Data for force as a function of Distance Analysis for part one: 1 - Use excel and graph FE as a function of no. comments on the graph, what shape do you expect? Fit the experimental points with a power function. Display the equation in the Graph. Use the "constant" in the equation to find the Coulomb's constant k. Include the Graph and calculation here. 2 - Calculate the percentage error in k (theoretical- 8.987 - 10; Nm/C ). Include the percent error calculation here. 3- Make a linearized graph of this behavior, for this your need to add a column in the table of graph here. data of 1/12 then graph Force versus 1/r, fit this with linear trendline and include the
Step by Step Solution
There are 3 Steps involved in it

Get step-by-step solutions from verified subject matter experts