

Question: Answer 1-4 with your simple explanation. Thanks. Frequency Distribution and Graphical Representation of Data: Answer the following: 1. Construct the frequency table for each of
Answer 1-4 with your simple explanation. Thanks.
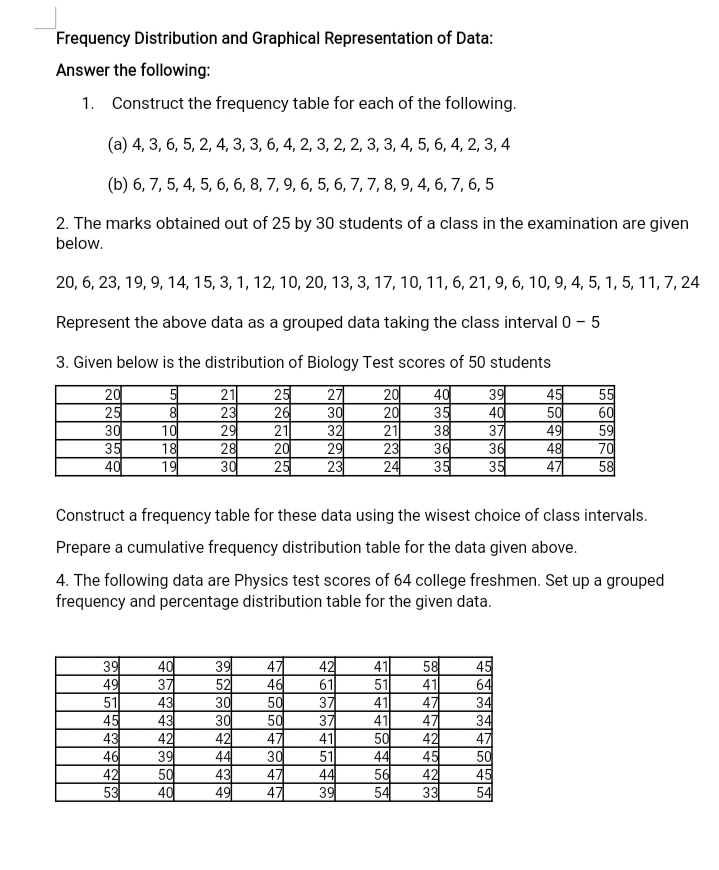
Frequency Distribution and Graphical Representation of Data: Answer the following: 1. Construct the frequency table for each of the following. (a) 4, 3, 6, 5, 2, 4, 3, 3, 6, 4, 2, 3, 2, 2, 3, 3, 4, 5, 6, 4, 2, 3, 4 (b) 6, 7, 5, 4, 5, 6, 6, 8, 7, 9, 6, 5, 6, 7, 7, 8, 9, 4, 6, 7, 6, 5 2. The marks obtained out of 25 by 30 students of a class in the examination are given below. 20, 6, 23, 19, 9, 14, 15, 3, 1, 12, 10, 20, 13, 3, 17, 10, 11, 6, 21, 9, 6, 10, 9, 4, 5, 1, 5, 11, 7, 24 Represent the above data as a grouped data taking the class interval 0 - 5 3. Given below is the distribution of Biology Test scores of 50 students 25 27 20 40 39 45 55 20 21 25 23 26 30 20 35 40 50 60 29 211 32 21 38 37 49 59 30 10 20 29 23 36 36 48 70 35 18 28 40 19 30 25 23 24 35 35 47 58 Construct a frequency table for these data using the wisest choice of class intervals. Prepare a cumulative frequency distribution table for the data given above. 4. The following data are Physics test scores of 64 college freshmen. Set up a grouped frequency and percentage distribution table for the given data. 39 40 39 47 42 58 45 52 46 61 51 41 64 49 37 51 43 30 50 37 41 34 45 43 30 50 41 34 42 42 50 40 49
Step by Step Solution
There are 3 Steps involved in it

Get step-by-step solutions from verified subject matter experts