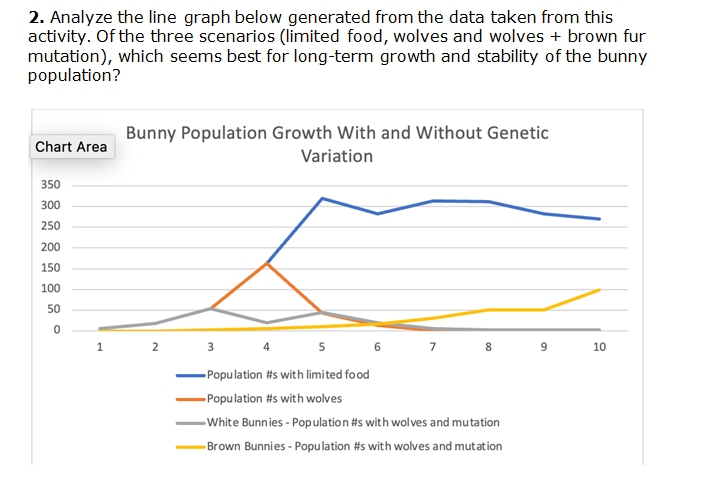
Question: Answer 2. Analyze the line graph below generated from the data taken from this activity. Of the three scenarios (limited food, wolves and wolves +

Answer

Answer 2. Analyze the line graph below generated
2. Analyze the line graph below generated from the data taken from this activity. Of the three scenarios (limited food, wolves and wolves + brown fur mutation), which seems best for long-term growth and stability of the bunny population? Bunny Population Growth With and Without Genetic Chart Area Variation 350 300 250 200 150 100 50 0 1 2 3 4 5 6 7 8 9 10 Population #s with limited food Population #s with wolves White Bunnies - Population #s with wolves and mutation Brown Bunnies - Population #s with wolves and mutation

Step by Step Solution

There are 3 Steps involved in it

1 Expert Approved Answer
Step: 1 Unlock blur-text-image
Question Has Been Solved by an Expert!

Get step-by-step solutions from verified subject matter experts

Step: 2 Unlock
Step: 3 Unlock

Students Have Also Explored These Related Accounting Questions!