

Question: Answer 31 for Motivation A, Method B & C, Mechanics D-F, and Message G PTER 2 Dai The data for Best Buy come from another
Answer 31 for Motivation A, Method B & C, Mechanics D-F, and Message G
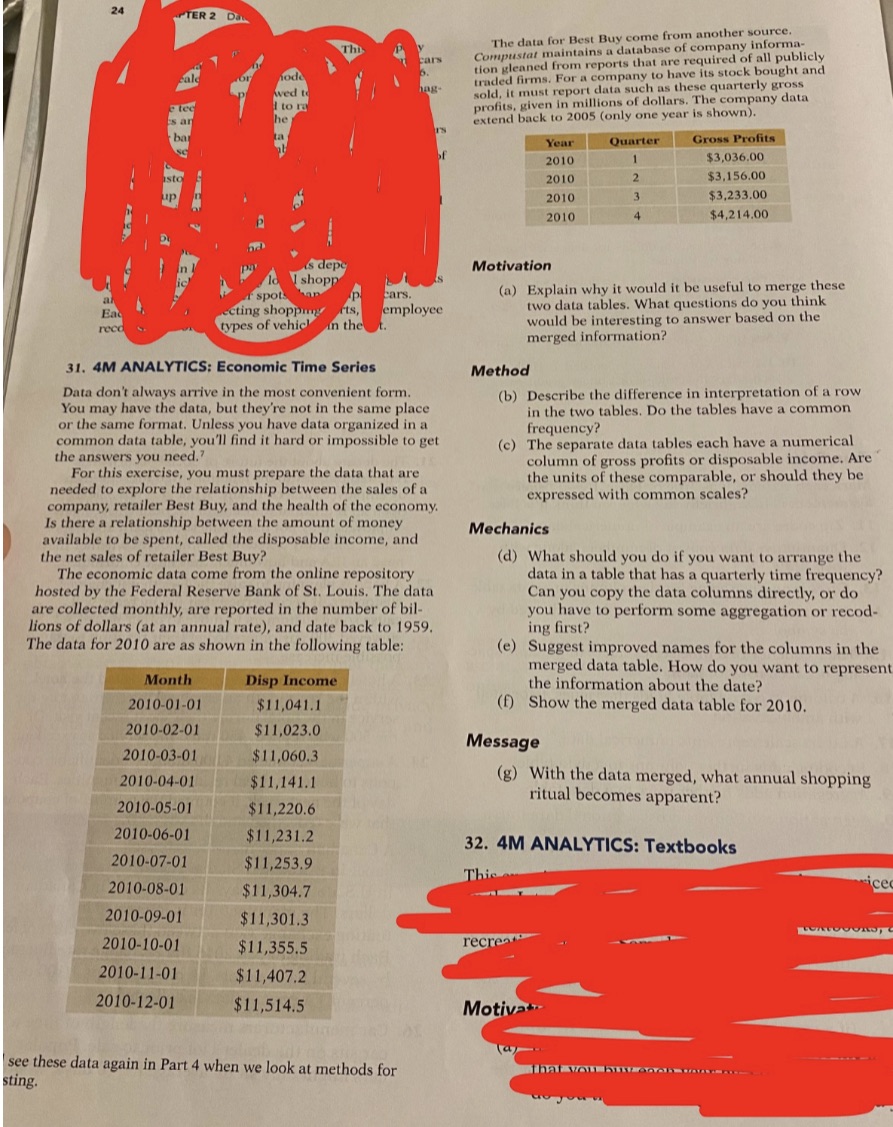
PTER 2 Dai The data for Best Buy come from another source, Th Compustar maintains a database of company informa- tion gleaned from reports that are required of all publicly Fale Tode traded firms. For a company to have its stock bought and sold, it must report data such as these quarterly gross tee to ro profits, given in millions of dollars. The company data s an he extend back to 2005 (only one year is shown). Year Quarter Gross Profits 2010 $3,036.00 sto 2010 $3,156.00 N up 2010 $3,233.00 2010 $4,214.00 is dep Motivation I shopp f spots cars. (a) Explain why it would it be useful to merge these ecting shoppmy employee two data tables. What questions do you think types of vehicl in the would be interesting to answer based on the merged information? 31. 4M ANALYTICS: Economic Time Series Method Data don't always arrive in the most convenient form. (b) Describe the difference in interpretation of a row You may have the data, but they're not in the same place in the two tables. Do the tables have a common or the same format. Unless you have data organized in a frequency? common data table, you'll find it hard or impossible to get (c) The separate data tables each have a numerical the answers you need.' column of gross profits or disposable income. Are For this exercise, you must prepare the data that are the units of these comparable, or should they be needed to explore the relationship between the sales of a expressed with common scales? company, retailer Best Buy, and the health of the economy. Is there a relationship between the amount of money Mechanics available to be spent, called the disposable income, and the net sales of retailer Best Buy? (d) What should you do if you want to arrange the The economic data come from the online repository data in a table that has a quarterly time frequency? hosted by the Federal Reserve Bank of St. Louis. The data Can you copy the data columns directly, or do are collected monthly, are reported in the number of bil- you have to perform some aggregation or recod- lions of dollars (at an annual rate), and date back to 1959. ing first? The data for 2010 are as shown in the following table: (e) Suggest improved names for the columns in the merged data table. How do you want to represent Month Disp Income the information about the date? 2010-01-01 $11,041.1 (f) Show the merged data table for 2010. 2010-02-01 $11,023.0 Message 2010-03-01 $11,060.3 2010-04-01 $11,141.1 (g) With the data merged, what annual shopping 2010-05-01 $11,220.6 ritual becomes apparent? 2010-06-01 $11,231.2 32. 4M ANALYTICS: Textbooks 2010-07-01 $11,253.9 This 2010-08-01 $11,304.7 ice 2010-09-01 $11,301.3 2010-10-01 $11,355.5 recreat 2010-11-01 $11,407.2 2010-12-01 $11,514.5 Motiva see these data again in Part 4 when we look at methods for that voll buzzedademasme- sting
Step by Step Solution
There are 3 Steps involved in it

Get step-by-step solutions from verified subject matter experts