

Question: Answer all please Problems 6-10: Suppose you carry out a lab where you are investigating the relationship between f, k, and m, where fis the
Answer all please
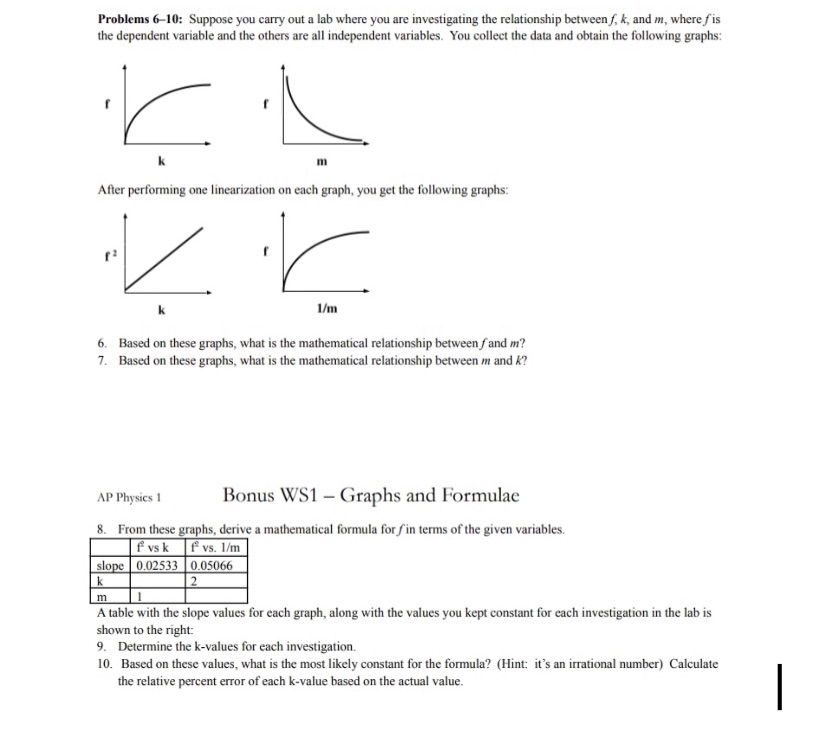
Problems 6-10: Suppose you carry out a lab where you are investigating the relationship between f, k, and m, where fis the dependent variable and the others are all independent variables. You collect the data and obtain the following graphs: m After performing one linearization on each graph, you get the following graphs: 1/m 6. Based on these graphs, what is the mathematical relationship between f and m? 7. Based on these graphs, what is the mathematical relationship between m and A? AP Physics 1 Bonus WS1 - Graphs and Formulae 8. From these graphs, derive a mathematical formula for f'in terms of the given variables. f vs k f vs. 1/m slope | 0.02533 0.05066 m A table with the slope values for each graph, along with the values you kept constant for each investigation in the lab is shown to the right: 9. Determine the k-values for each investigation. 10. Based on these values, what is the most likely constant for the formula? (Hint: it's an irrational number) Calculate the relative percent error of each k-value based on the actual value
Step by Step Solution
There are 3 Steps involved in it

Get step-by-step solutions from verified subject matter experts