

Question: ANSWER ALL PLEASE The table below shows a reading of well log data on the shale and sand formation. Vp (m/s) Vs(m/s) Rho (g/cc) Shale
ANSWER ALL PLEASE 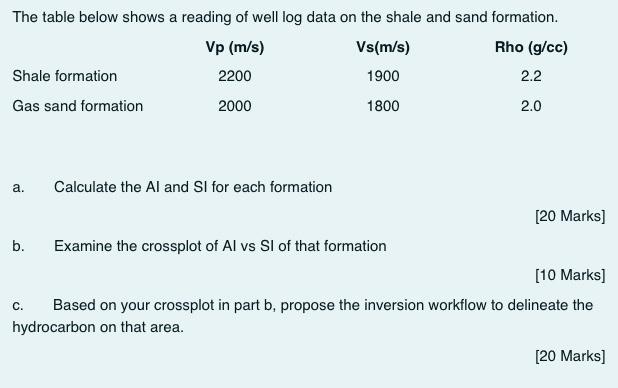
The table below shows a reading of well log data on the shale and sand formation. Vp (m/s) Vs(m/s) Rho (g/cc) Shale formation 2200 1900 2.2 Gas sand formation 2000 1800 2.0 a. Calculate the Al and Sl for each formation [20 Marks] b. Examine the crossplot of Al vs Sl of that formation (10 Marks) c. Based on your crossplot in part b, propose the inversion workflow to delineate the hydrocarbon on that area. [20 Marks]
Step by Step Solution
There are 3 Steps involved in it
1 Expert Approved Answer
Step: 1 Unlock

Question Has Been Solved by an Expert!
Get step-by-step solutions from verified subject matter experts
Step: 2 Unlock
Step: 3 Unlock