

Question: Answer all questions use spss, use tableau to answer the questions ____._.-_ _, _, _, _, . , _..._. . . _.. _ __.___. _..

Answer all questions
use spss, use tableau to answer the questions
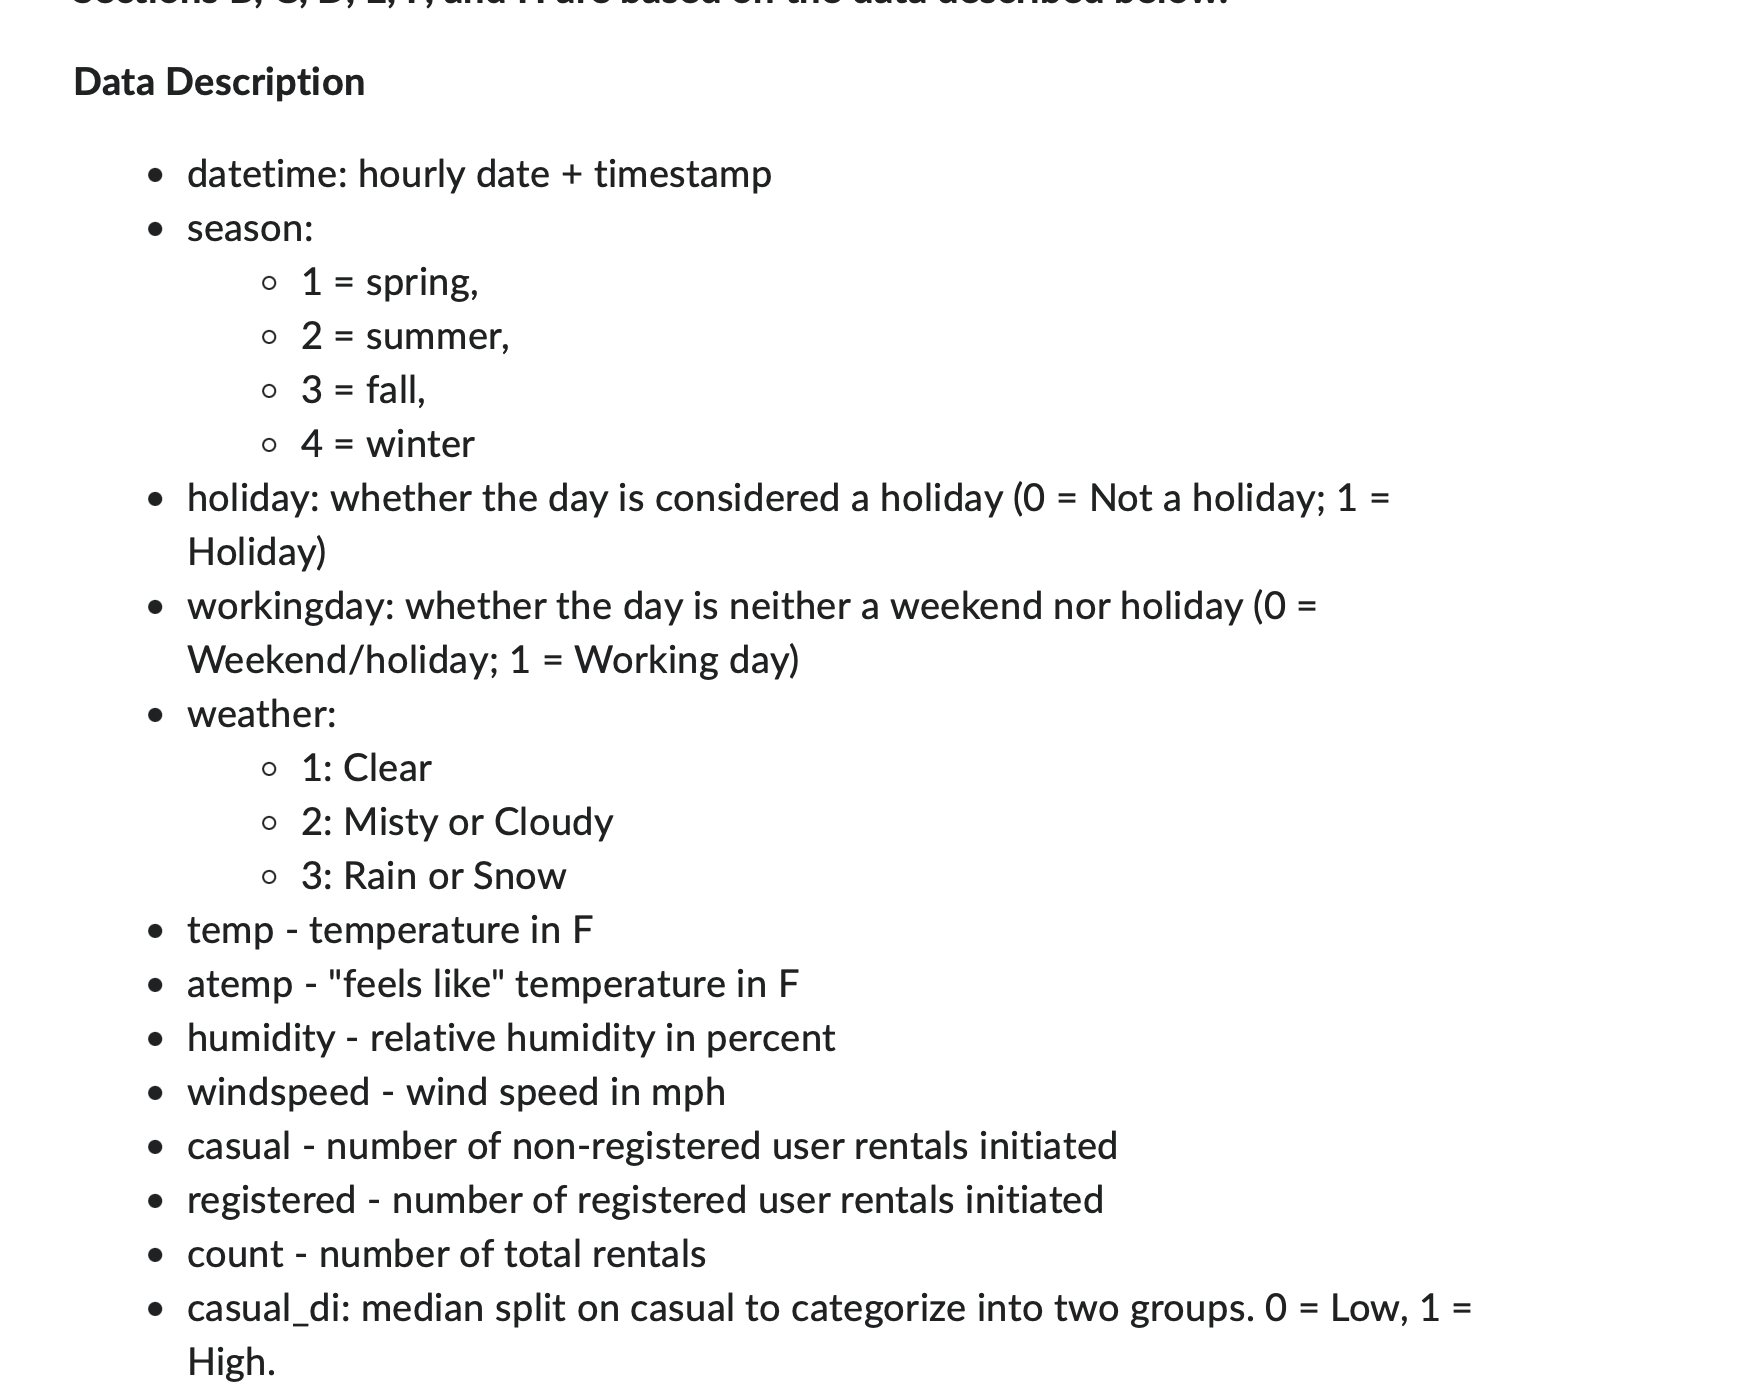
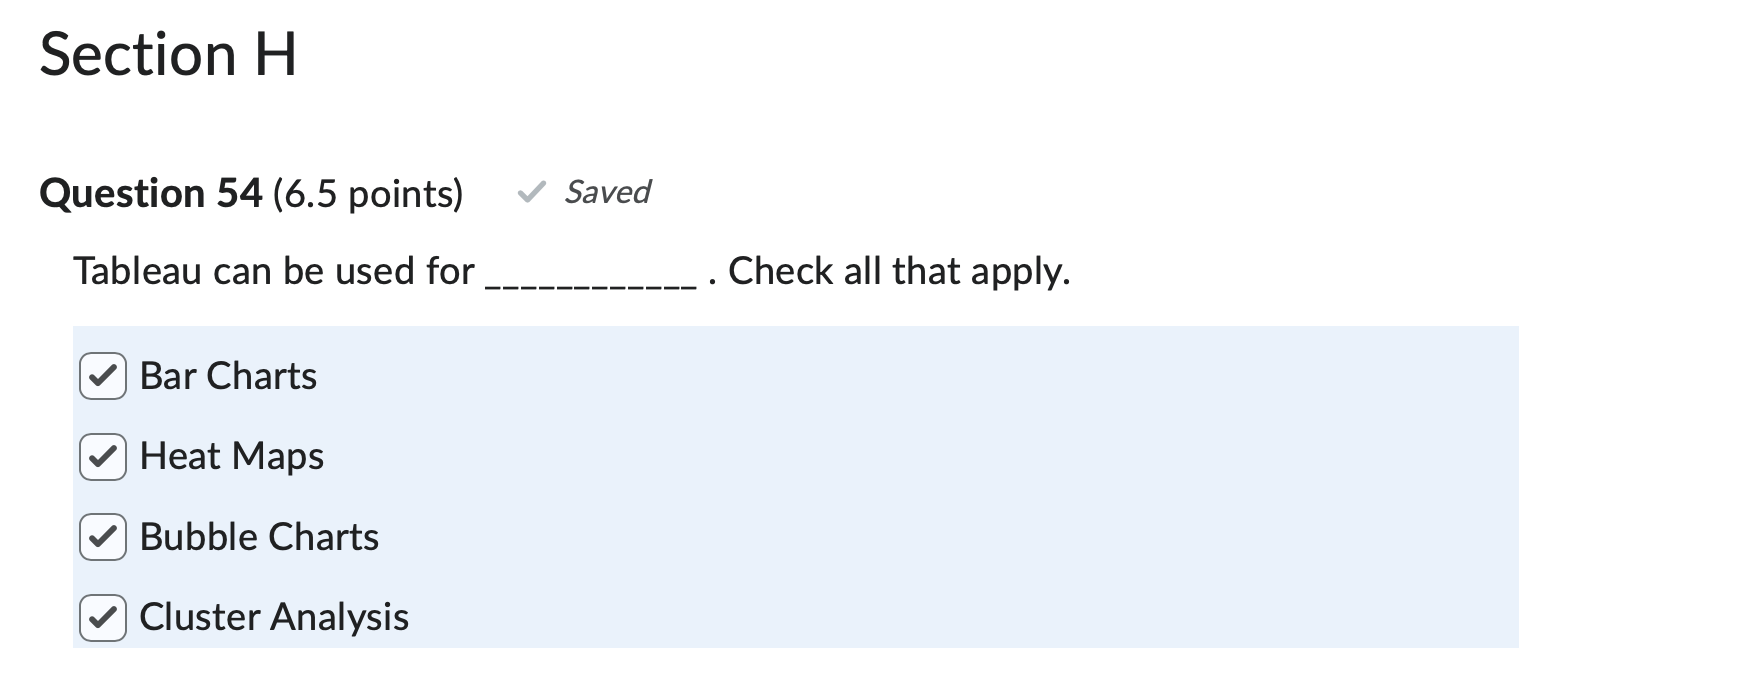
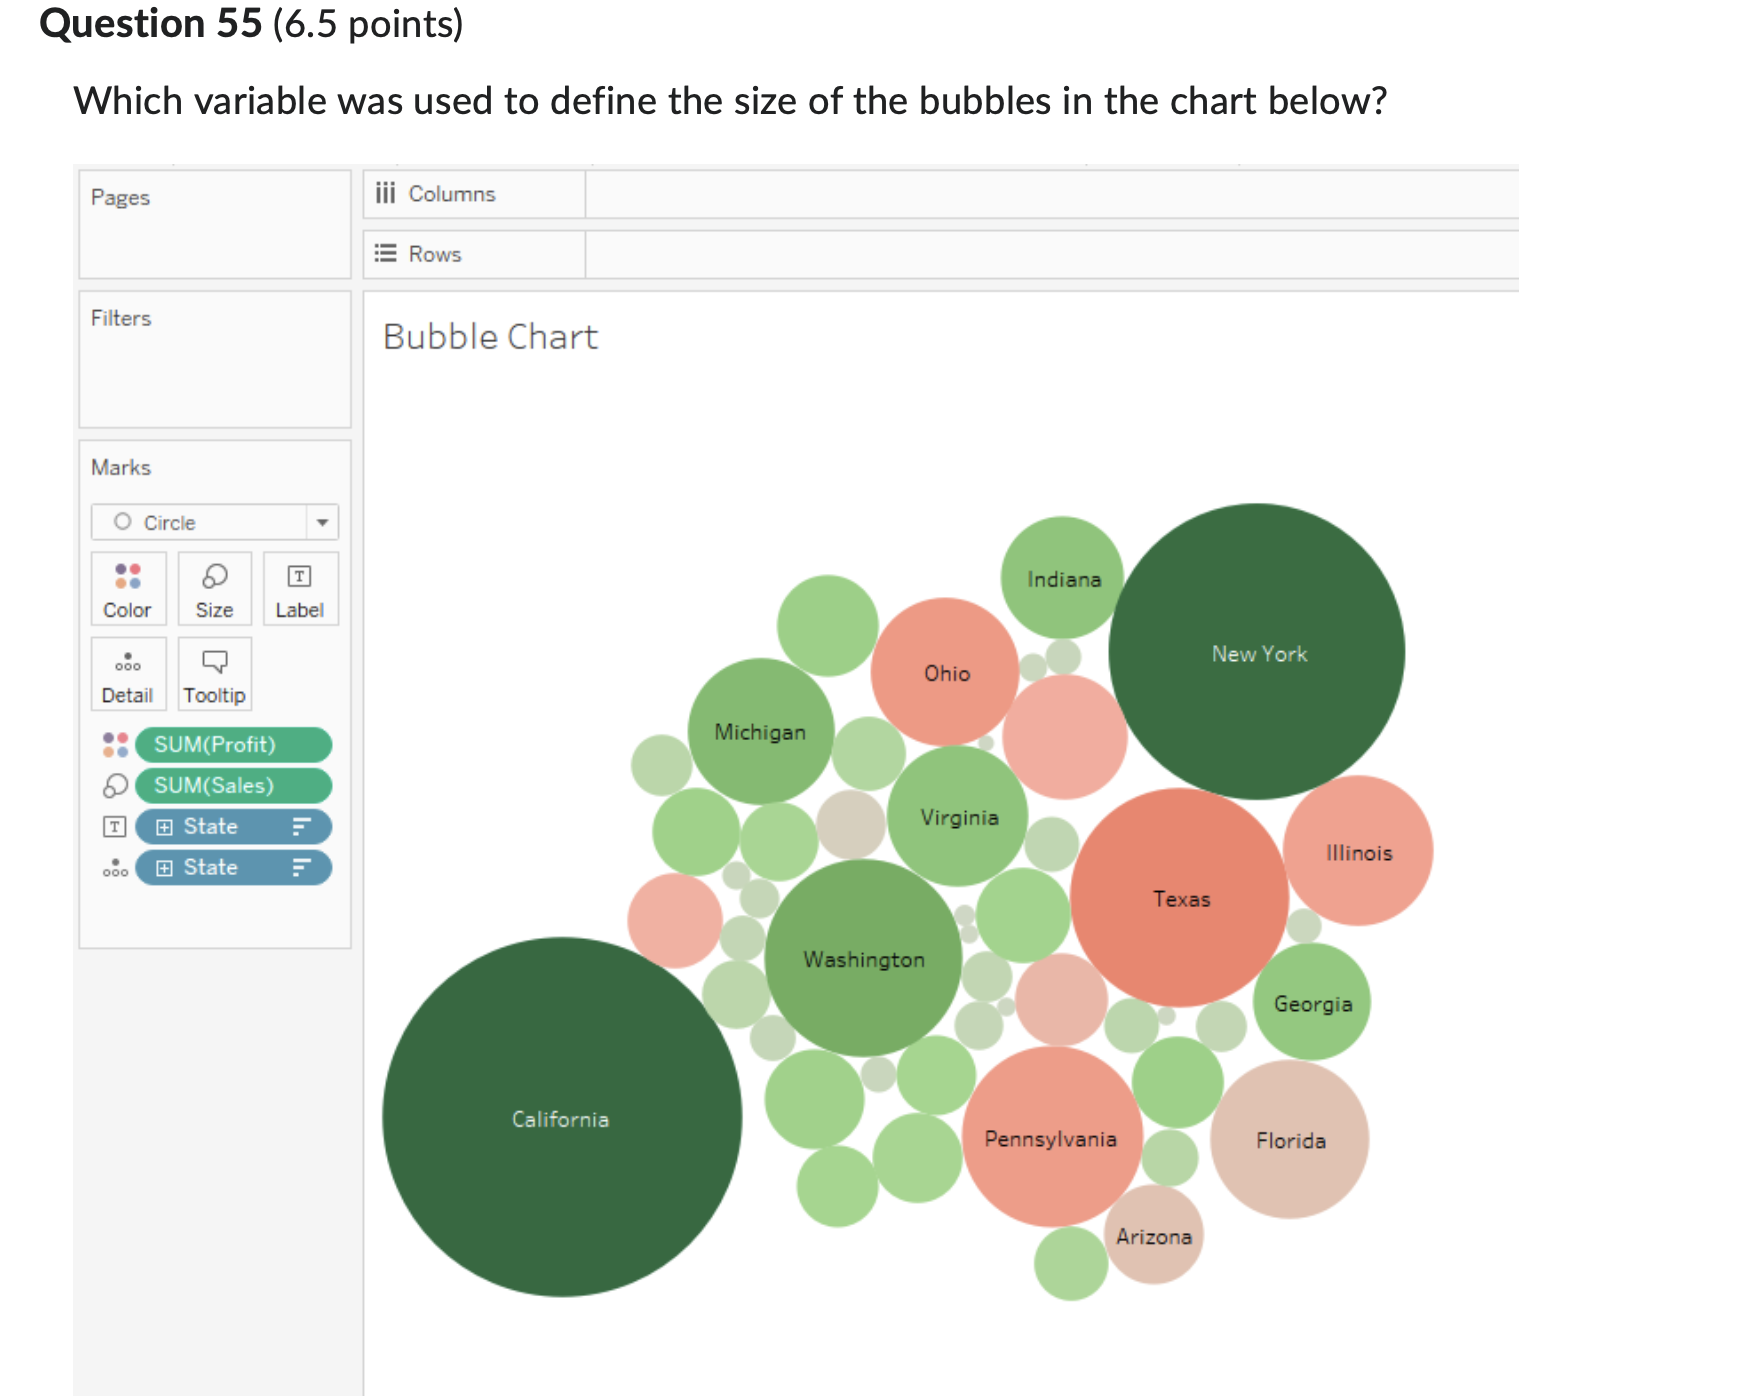
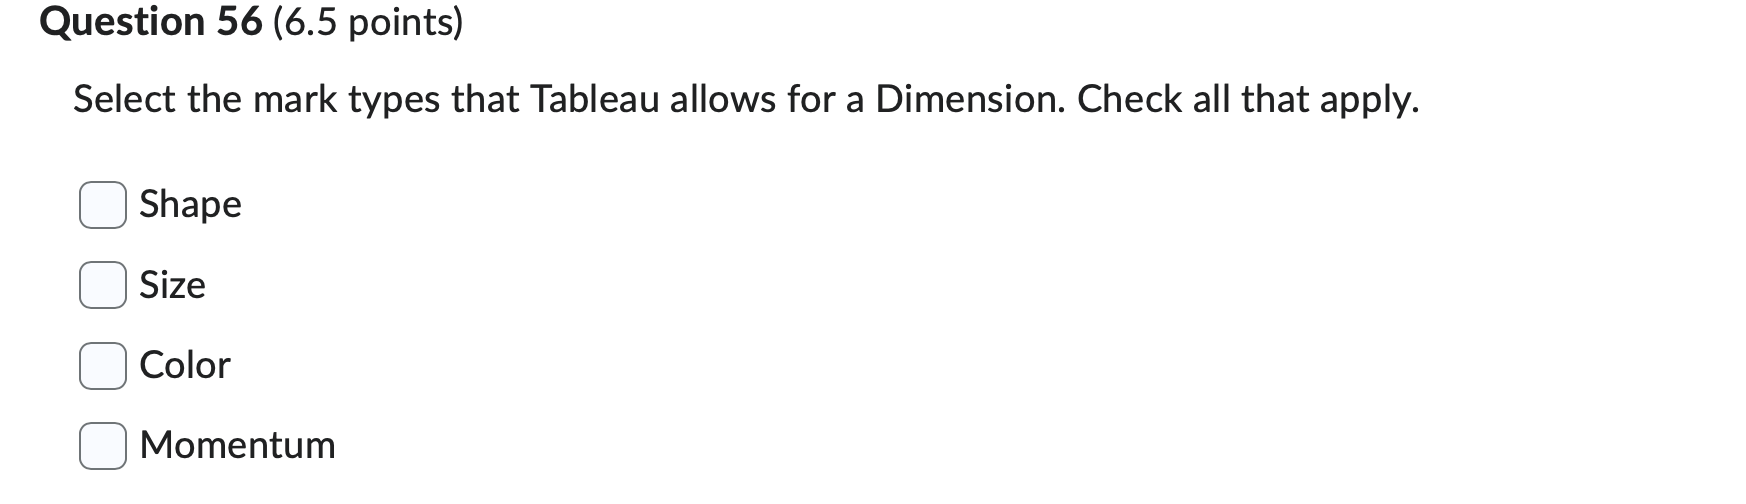


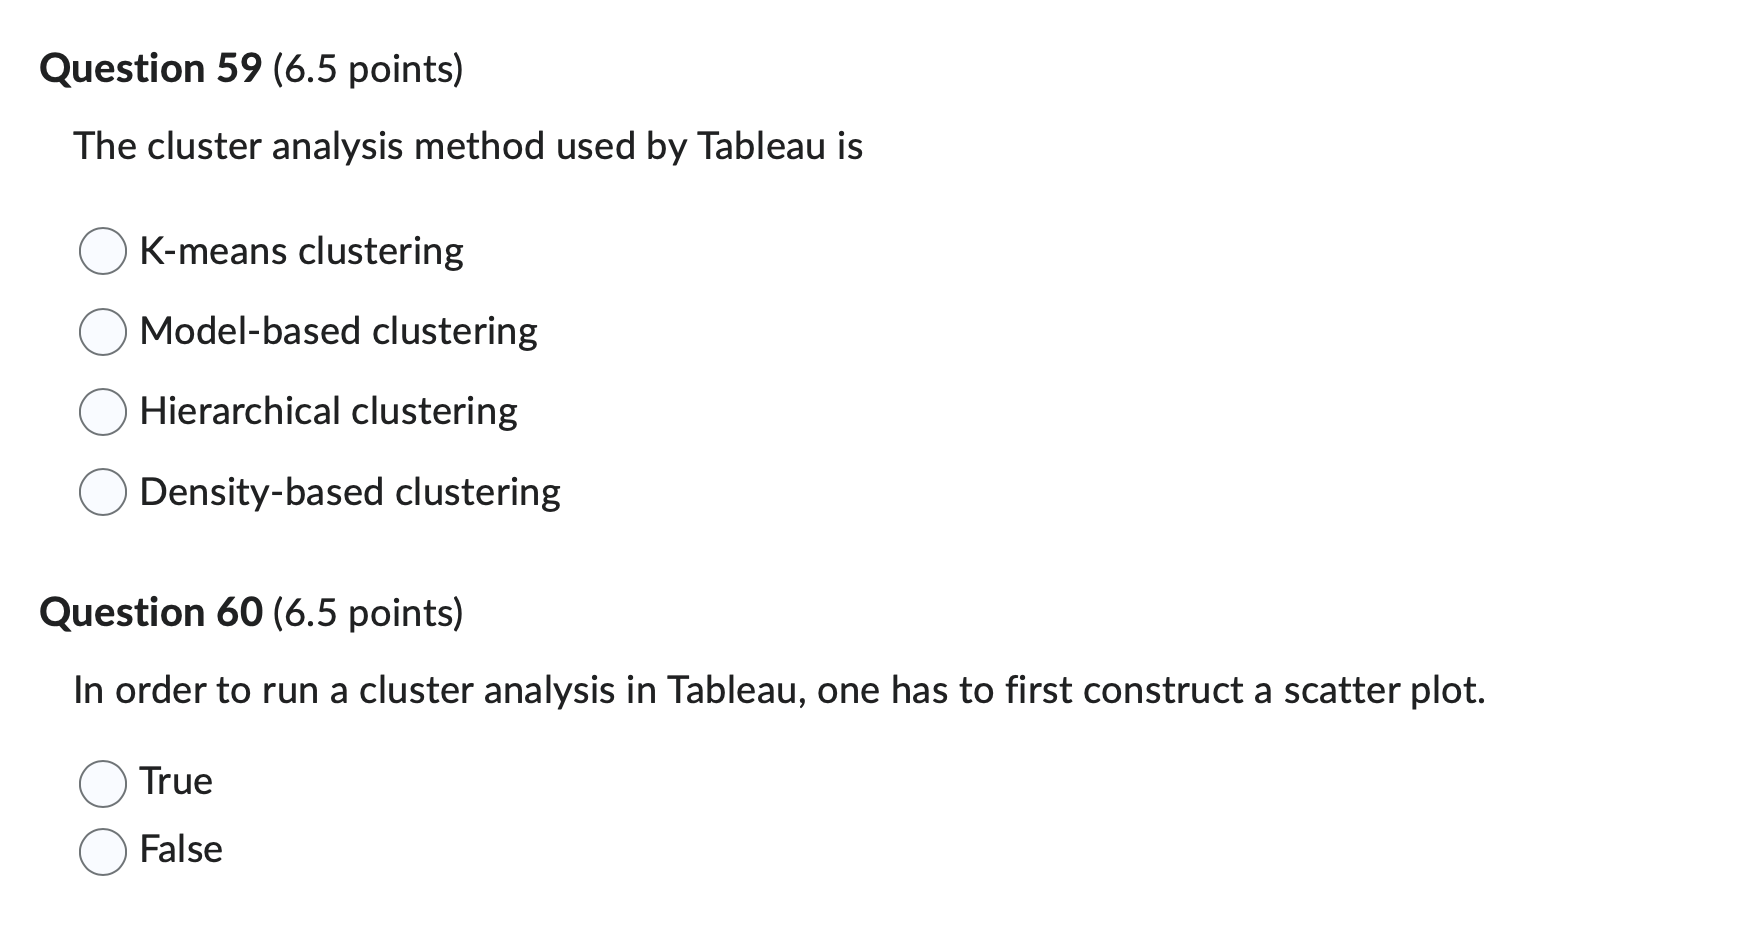
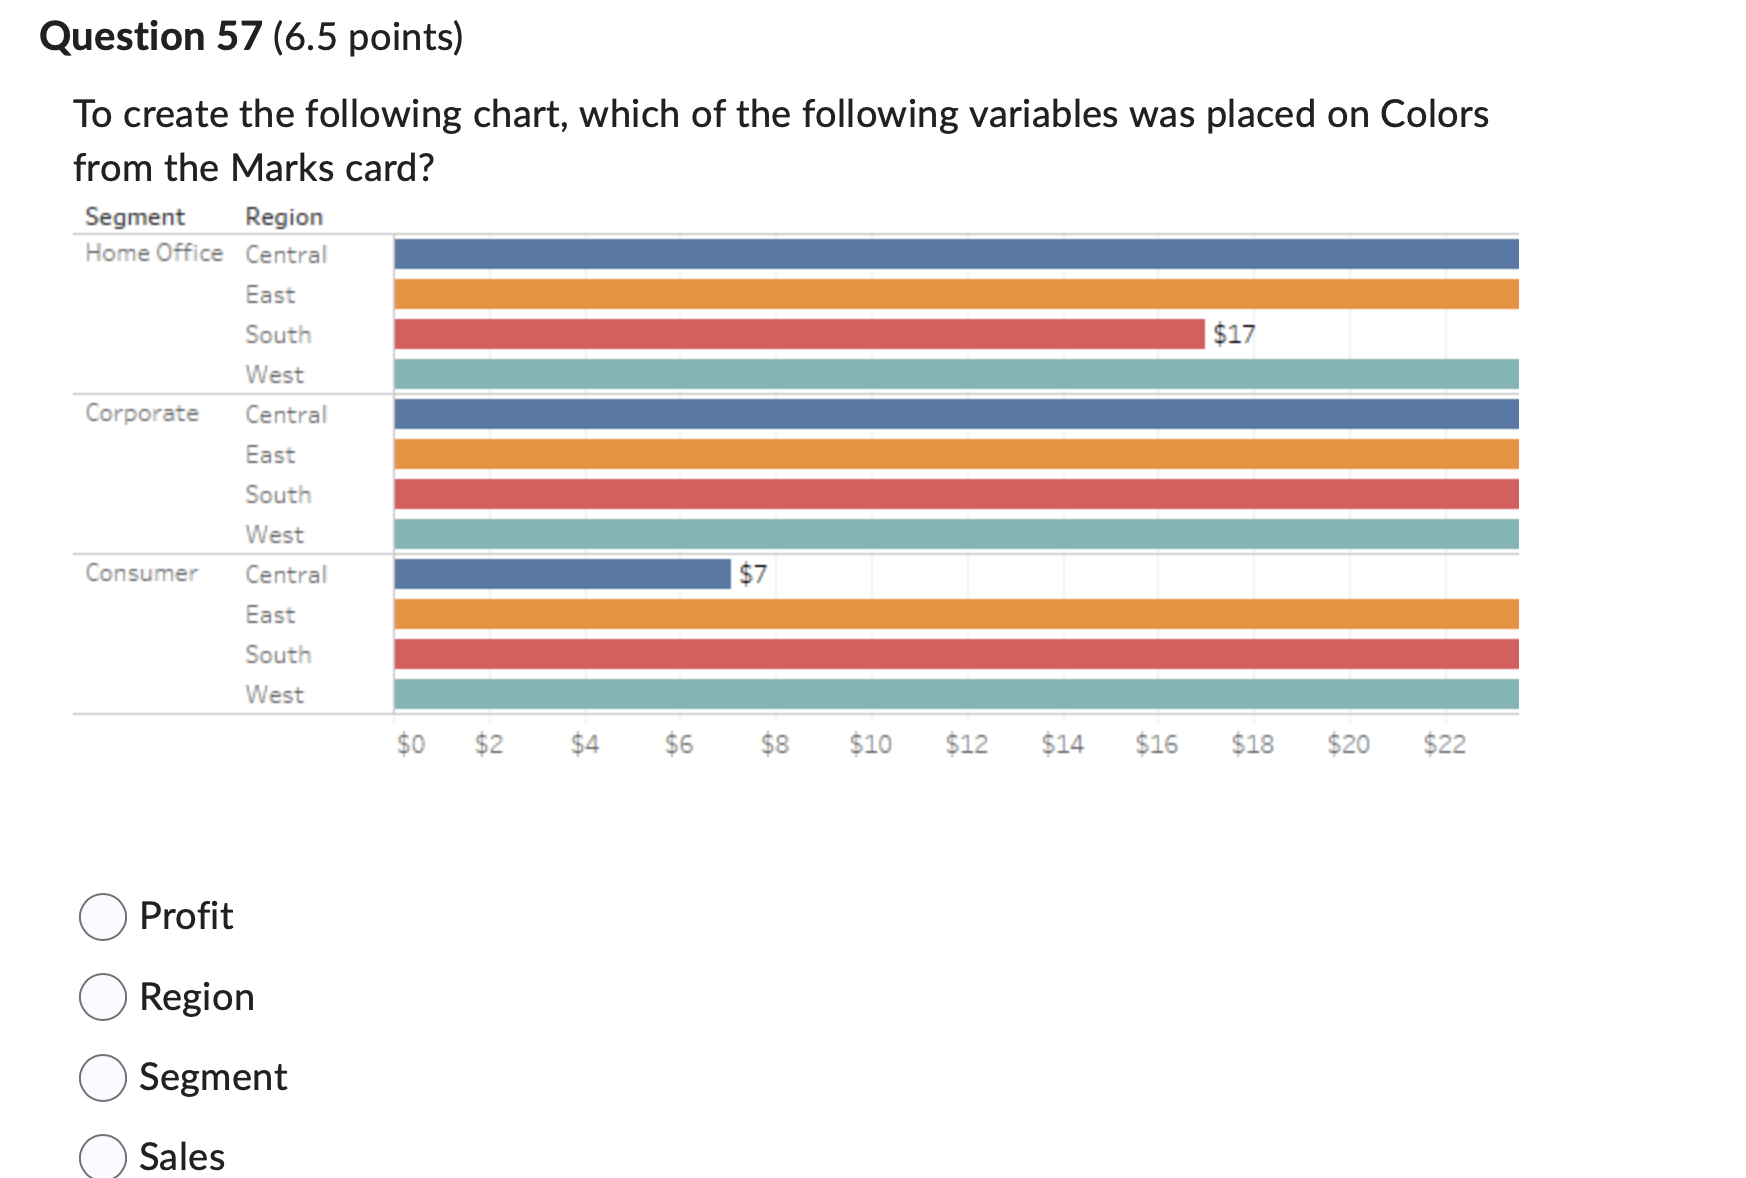
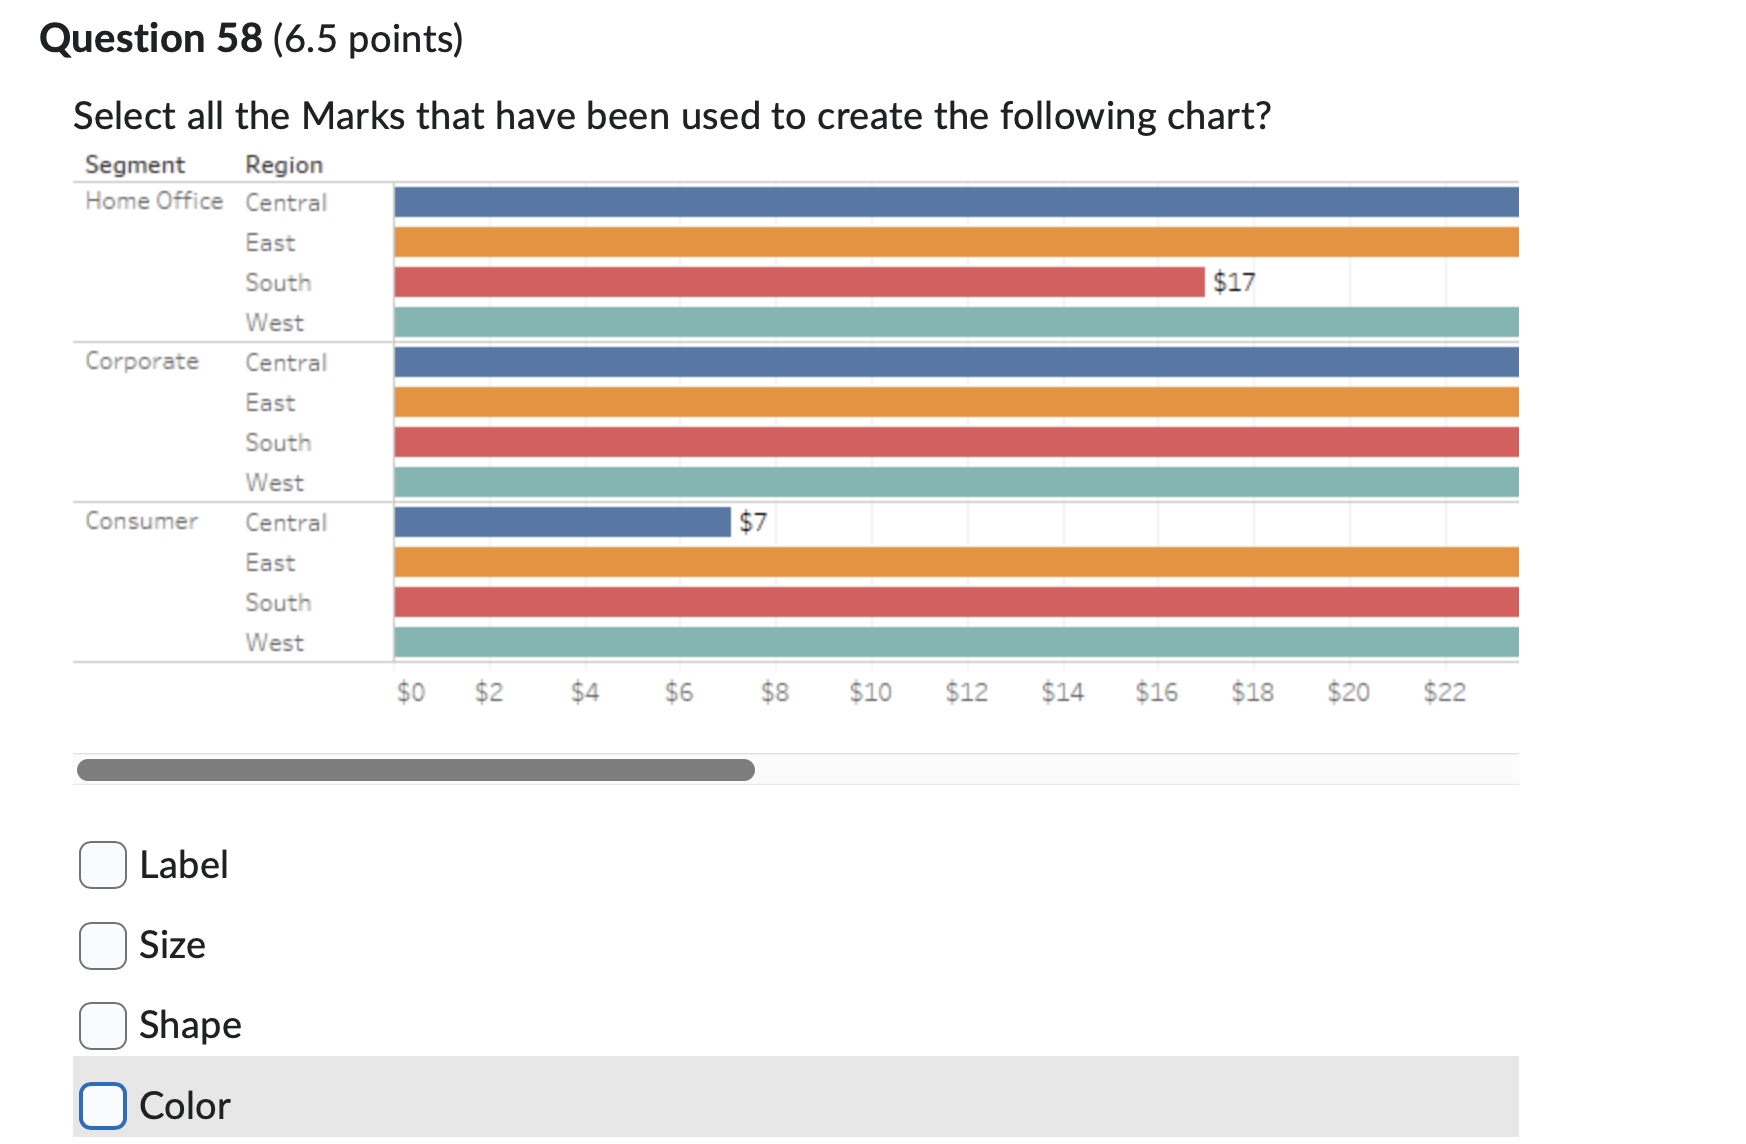
____._.-_ _, _, _, _, . , _..._. . . _.. _ __.___. _.. _.-_ _._.__. _.___..___. __._--- Data Description 0 datetime: hourly date + timestamp 0 season: 0 1 = spring, 0 2 = summer, 0 3 = fall, 0 4 = winter 0 holiday: whether the day is considered a holiday (0 = Not a holiday; 1 = Holiday) - workingday: whether the day is neither a weekend nor holiday (0 = Weekend/holiday; 1 = Working day) 0 weather: 0 1: Clear 0 2: Misty or Cloudy o 3: Rain or Snow 0 temp - temperature in F o atemp - "feels like" temperature in F o humidity - relative humidity in percent 0 windspeed - wind speed in mph 0 casual - number of non-registered user rentals initiated - registered - number of registered user rentals initiated 0 count - number of total rentals 0 casual_di: median split on casual to categorize into two groups. 0 = Low, 1 = High. Section H Question 54 (6.5 points) Saved Tableau can be used for ____________ . Check all that apply. Bar Charts Heat Maps Bubble Charts Cluster Analysis Question 55 (6.5 points) Which variable was used to define the size of the bubbles in the chart below? Pages lll Columns 55 Rows Filters 8 u b bl e C h a rt Marks 0 Circle V :: 53 Color Size Label coo l: Detail Tooltip ::- SUM(ProfIt) (Q SUM(Sales) - ooo _ _tate .9 O Sales Color Profit State O SizeQuestion 56 (6.5 points) Select the mark types that Tableau allows for a Dimension. Check all that apply. C] Momentum Question 57 (6.5 points) To create the following chart, which of the following variables was placed on Colors from the Marks card? Segment Region Home Office Central East South $17 West Corporate Central East South West Consumer Central $7 East South West $0 $2 $4 $6 $8 $10 $12 $14 $16 $18 $20 $22 Profit O Region Segment SalesQuestion 58 (6.5 points) Select all the Marks that have been used to create the following chart? Segment Region Home Office Central East South $17 West Corporate Central East South West Consumer Central $7 East South West $0 $2 $4 $6 $8 $10 $12 $14 $16 $18 $20 $22 Label O Size Shape ColorQuestion 59 (6.5 points) The cluster analysis method used by Tableau is O K-means clustering O Model-based clustering O Hierarchical clustering O Density-based clustering Question 60 (6.5 points) In order to run a cluster analysis in Tableau, one has to first construct a scatter plot
Step by Step Solution
There are 3 Steps involved in it

Get step-by-step solutions from verified subject matter experts