Question: AutoSave OFF A ACGP ... w- Data Visualization Assignment 2 - Saved to my Mac Home Insert Draw Design Layout References Mailings Review View ?
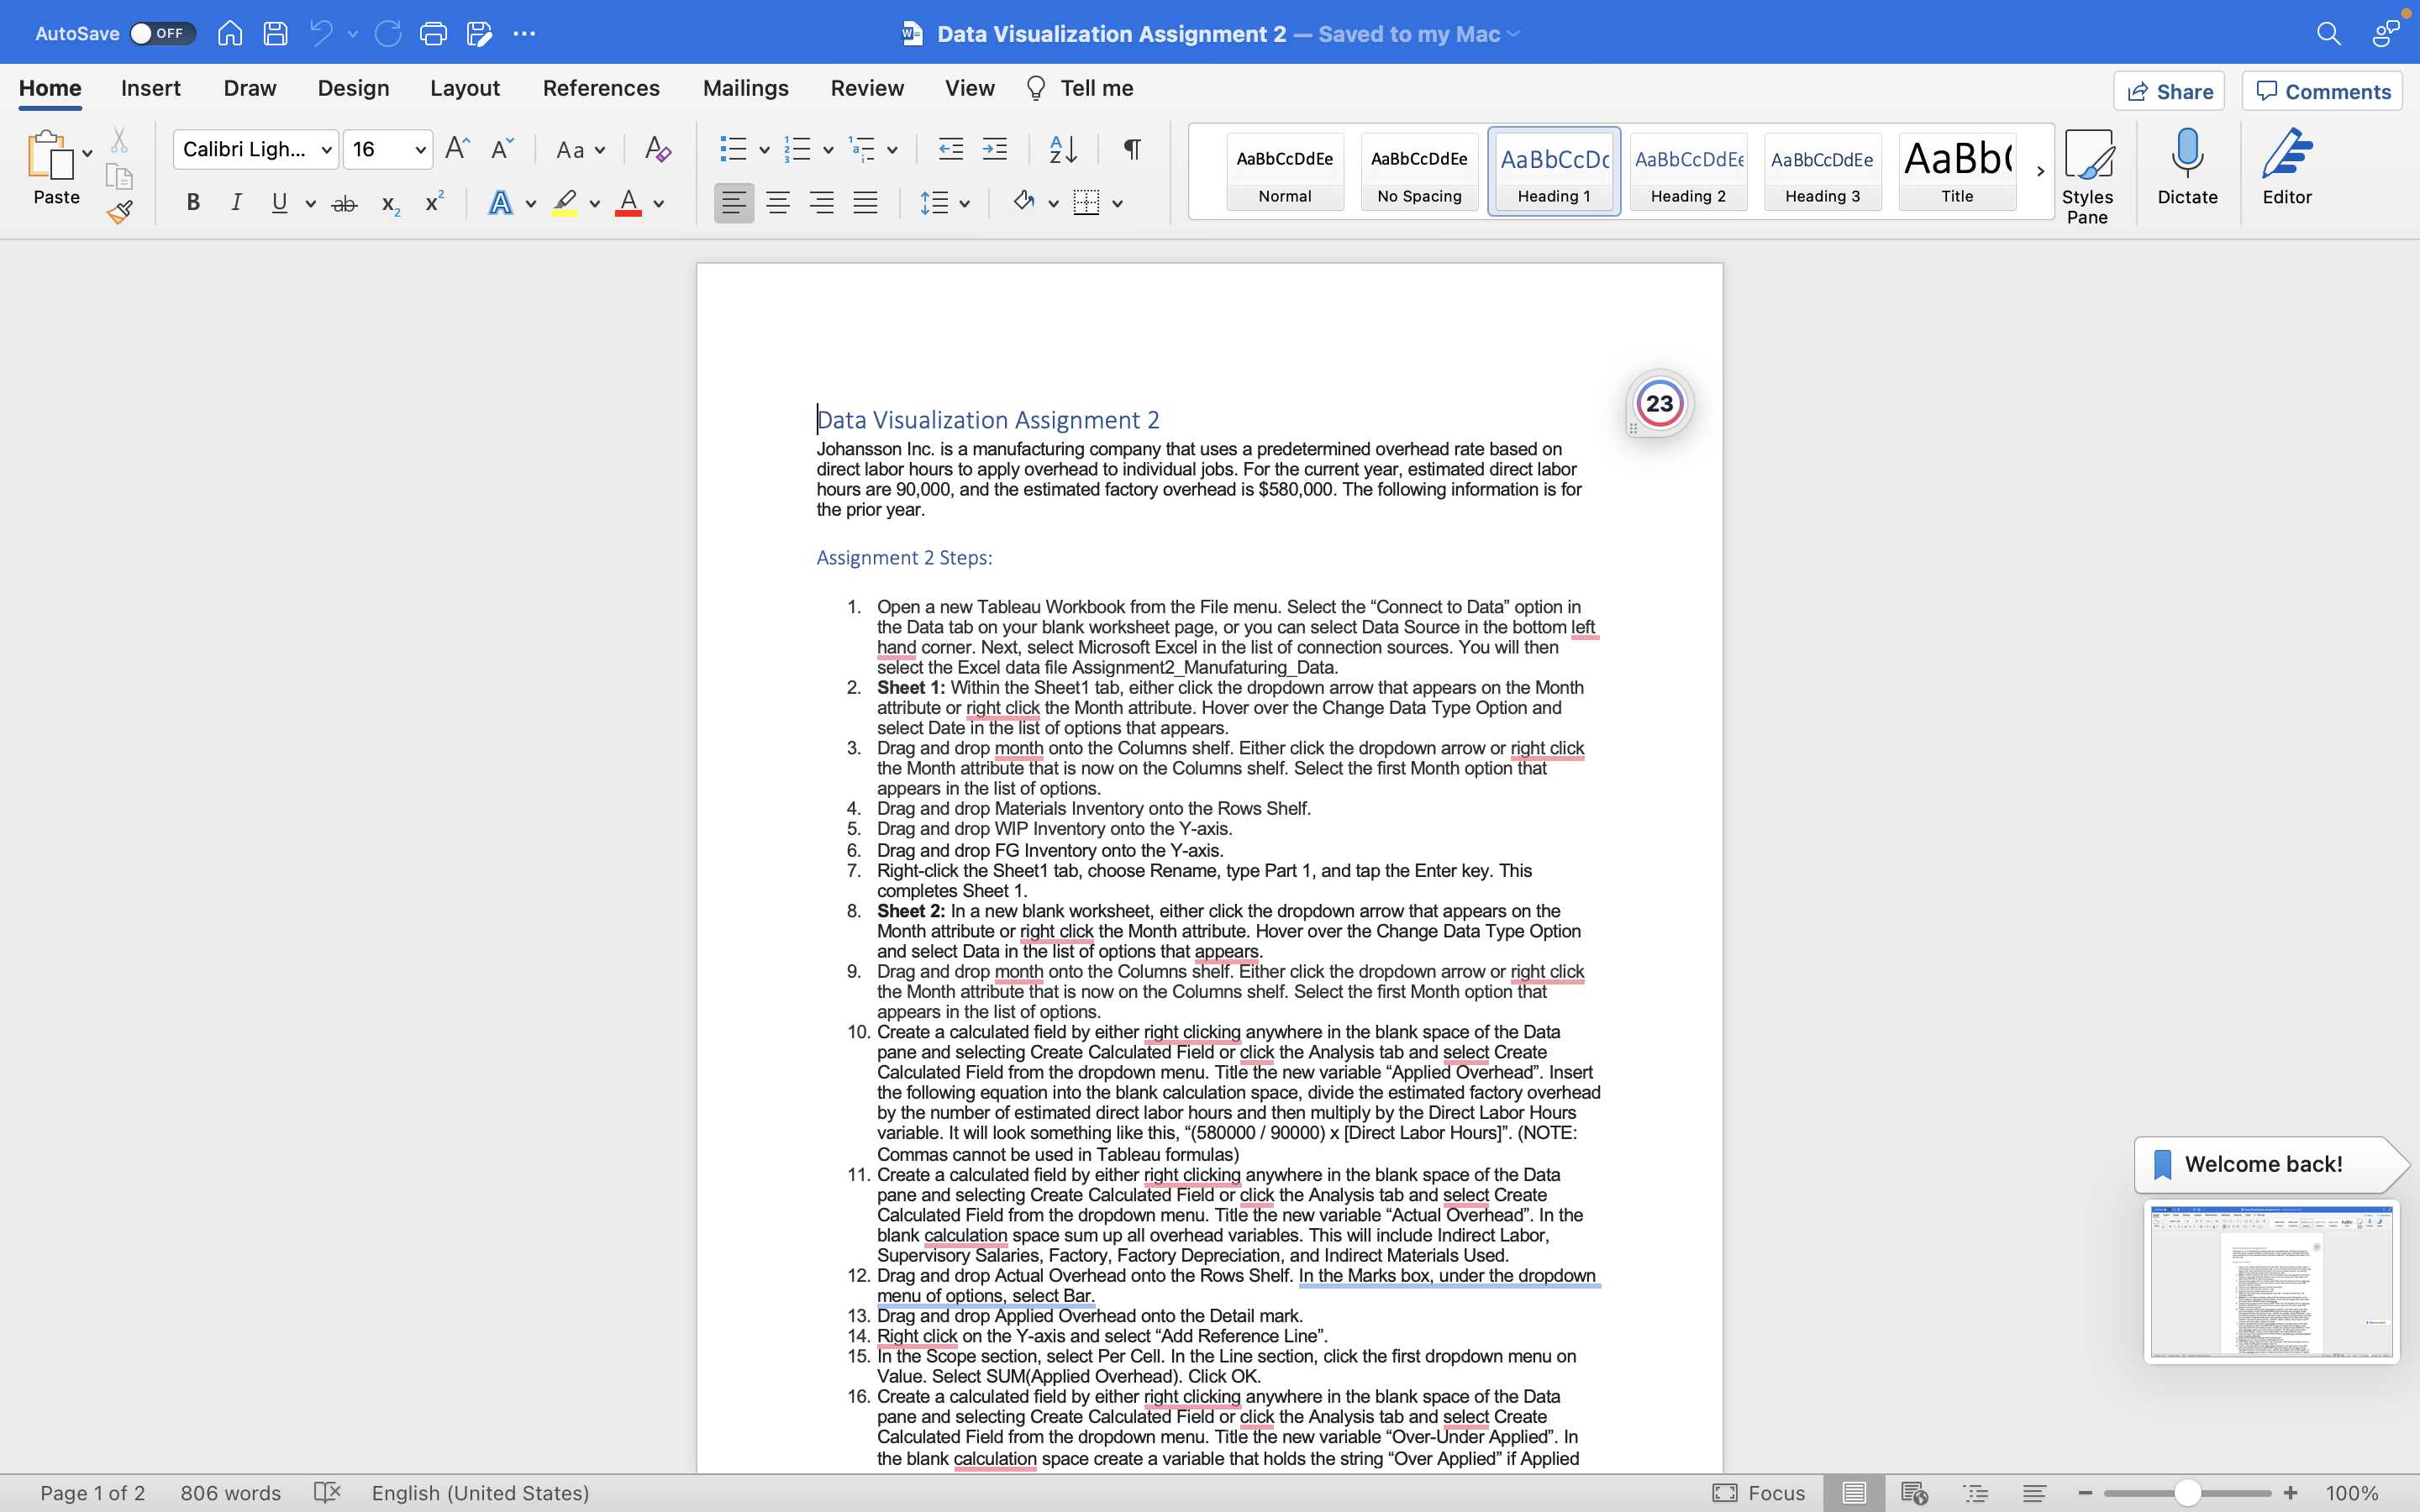
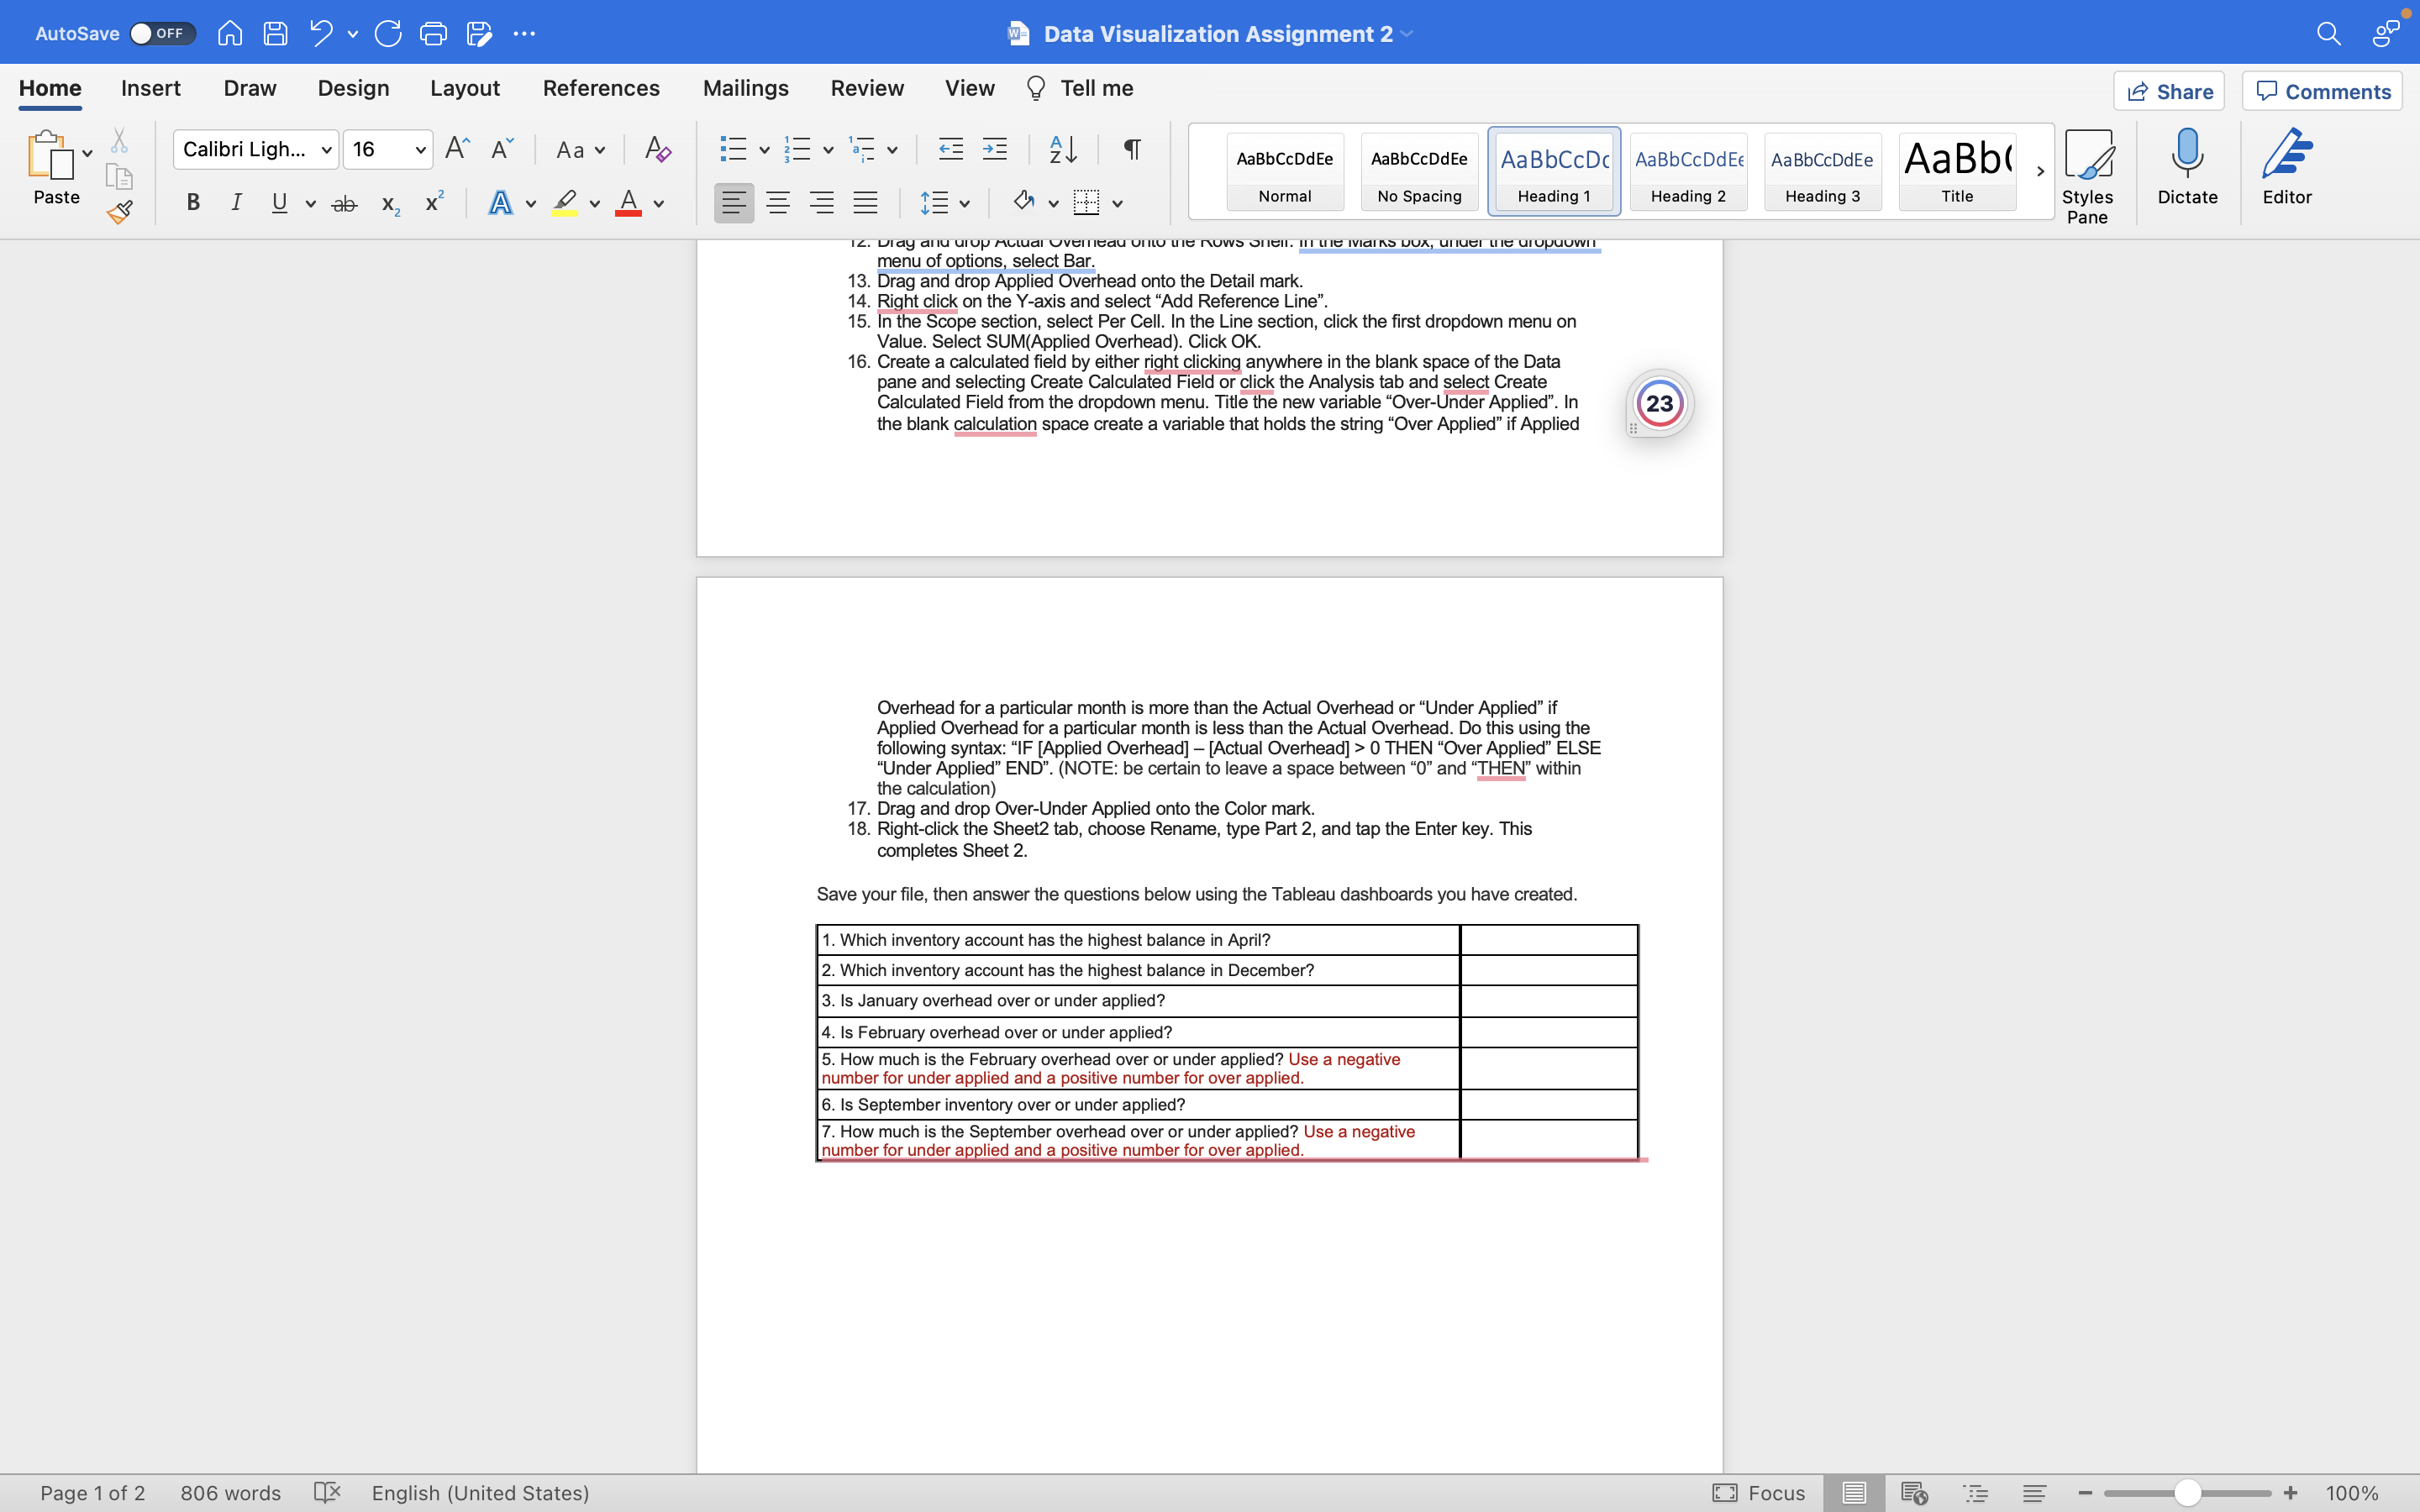
AutoSave OFF A ACGP ... w- Data Visualization Assignment 2 - Saved to my Mac Home Insert Draw Design Layout References Mailings Review View ? Tell me Share Comments Calibri Ligh... v 16 A A Aa Ap AaBbCcDdEe AaBbCcDdEe AaBbCcDc AaBbCcDdEE AaBbCcDdEe AaBb( , Paste BI Uvab X X |A DAY Normal No Spacing Heading 1 Heading 2 Heading 3 Title Styles Dictate Editor Pane Data Visualization Assignment 2 23 Johansson Inc. is a manufacturing company that uses a predetermined overhead rate based on direct labor hours to apply overhead to individual jobs. For the current year, estimated direct labor hours are 90,000, and the estimated factory overhead is $580,000. The following information is for the prior year. Assignment 2 Steps: 1. Open a new Tableau Workbook from the File menu. Select the "Connect to Data" option in the Data tab on your blank worksheet page, or you can select Data Source in the bottom left hand corner. Next, select Microsoft Excel in the list of connection sources. You will then select the Excel data file Assignment2_Manufaturing_Data. 2. Sheet 1: Within the Sheet1 tab, either click the dropdown arrow that appears on the Month attribute or right click the Month attribute. Hover over the Change Data Type Option and select Date in the list of options that appears. 3. Drag and drop month onto the Columns shelf. Either click the dropdown arrow or right click the Month attribute that is now on the Columns shelf. Select the first Month option that appears in the list of options. Drag and drop Materials Inventory onto the Rows Shelf. 5. Drag and drop WIP Inventory onto the Y-axis 6. Drag and drop FG Inventory onto the Y-axis. 7. Right-click the Sheet1 tab, choose Rename, type Part 1, and tap the Enter key. This completes Sheet 1. 8. Sheet 2: In a new blank worksheet, either click the dropdown arrow that appears on the Month attribute or right click the Month attribute. Hover over the Change Data Type Option and select Data in the list of options that appears. 9. Drag and drop month onto the Columns shelf. Either click the dropdown arrow or right click the Month attribute that is now on the Columns shelf. Select the first Month option that appears in the list of options. 10. Create a calculated field by either right clicking anywhere in the blank space of the Data pane and selecting Create Calculated Field or click the Analysis tab and select Create Calculated Field from the dropdown menu. Title the new variable "Applied Overhead". Insert the following equation into the blank calculation space, divide the estimated factory overhead by the number of estimated direct labor hours and then multiply by the Direct Labor Hours variable. It will look something like this, "(580000 / 90000) x [Direct Labor Hours]". (NOTE: Commas cannot be used in Tableau formulas) 11. Create a calculated field by either right clicking anywhere in the blank space of the Data Welcome back! pane and selecting Create Calculated Field or click the Analysis tab and select Create Calculated Field from the dropdown menu. Title the new variable "Actual Overhead". In the blank calculation space sum up all overhead variables. This will include Indirect Labor, Supervisory Salaries, Factory, Factory Depreciation, and Indirect Materials Used. 12. Drag and drop Actual Overhead onto the Rows Shelf. In the Marks box, under the dropdown menu of options, select Bar. 13. Drag and drop Applied Overhead onto the Detail mark. 14. Right click on the Y-axis and select "Add Reference Line" 15. In the Scope section, select Per Cell. In the Line section, click the first dropdown menu on Value. Select SUM(Applied Overhead). Click OK. 6. Create a calculated field by either right clicking anywhere in the blank space of the Data pane and selecting Create Calculated Field or click the Analysis tab and select Create Calculated Field from the dropdown menu. Title the new variable "Over-Under Applied". In the blank calculation space create a variable that holds the string "Over Applied" if Applied Page 1 of 2 806 words X English (United States) Focus E + 100%AutoSave O OFF A A . G G P ... w- Data Visualization Assignment 2 Home Insert Draw Design Layout References Mailings Review View ? Tell me Share Comments Calibri Ligh... v 16 A" A Aa Ap BEEVE VEE AaBbCcDdEe AaBbCcDdEe AaBbCcDc AaBbCcDdEE AaBbCcDdEe AaBb( , Paste BI Uvab X X A DAY EEEE Normal No Spacing Heading 1 Heading 2 Heading 3 Title Styles Dictate Editor Pane 12. Diay anu urop Actual Overeau onto the nows ofell. In the IVidIS DUX, unuel the uropuown menu of options, select Bar. 13. Drag and drop Applied Overhead onto the Detail mark. 14. Right click on the Y-axis and select "Add Reference Line". 15. In the Scope section, select Per Cell. In the Line section, click the first dropdown menu on Value. Select SUM(Applied Overhead). Click OK. 16. Create a calculated field by either right clicking anywhere in the blank space of the Data pane and selecting Create Calculated Field or click the Analysis tab and select Create Calculated Field from the dropdown menu. Title the new variable "Over-Under Applied". In 23 the blank calculation space create a variable that holds the string "Over Applied" if Applied Overhead for a particular month is more than the Actual Overhead or "Under Applied" if Applied Overhead for a particular month is less than the Actual Overhead. Do this using the following syntax: "IF [Applied Overhead] - [Actual Overhead] > 0 THEN "Over Applied" ELSE "Under Applied" END". (NOTE: be certain to leave a space between "0" and "THEN" within the calculation) 17. Drag and drop Over-Under Applied onto the Color mark. 18. Right-click the Sheet2 tab, choose Rename, type Part 2, and tap the Enter key. This completes Sheet 2. Save your file, then answer the questions below using the Tableau dashboards you have created. 1. Which inventory account has the highest balance in April? 2. Which inventory account has the highest balance in December? 3. Is January overhead over or under applied? 4. Is February overhead over or under applied? 5. How much is the February overhead over or under applied? Use a negative number for under applied and a positive number for over applied. 6. Is September inventory over or under applied? 7. How much is the September overhead over or under applied? Use a negative number for under applied and a positive number for over applied. Page 1 of 2 806 words X English (United States) Focus E + 100%
Step by Step Solution
There are 3 Steps involved in it
1 Expert Approved Answer
Step: 1 Unlock
Question Has Been Solved by an Expert!
Get step-by-step solutions from verified subject matter experts
Step: 2 Unlock
Step: 3 Unlock
Students Have Also Explored These Related Accounting Questions!