

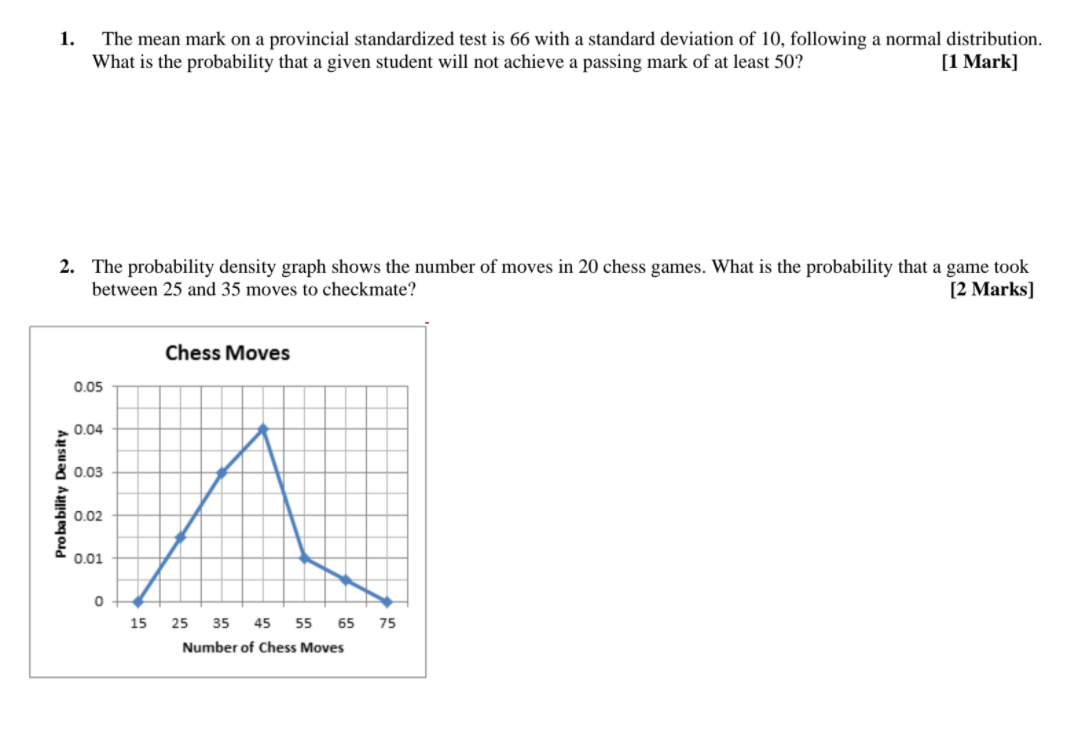
Question: answer as quickly as possible please 1. The mean mark on a provincial standardized test is 66 with a standard deviation of 10, following a

![will not achieve a passing mark of at least 50? [1 Mark]](https://s3.amazonaws.com/si.experts.images/answers/2024/06/66787f523ba5f_94666787f521517c.jpg)
![and 35 moves to checkmate? [2 Marks] Chess Moves 0.05 0.04 0.03](https://s3.amazonaws.com/si.experts.images/answers/2024/06/66787f53e5432_94766787f53c41cc.jpg)
answer as quickly as possible please


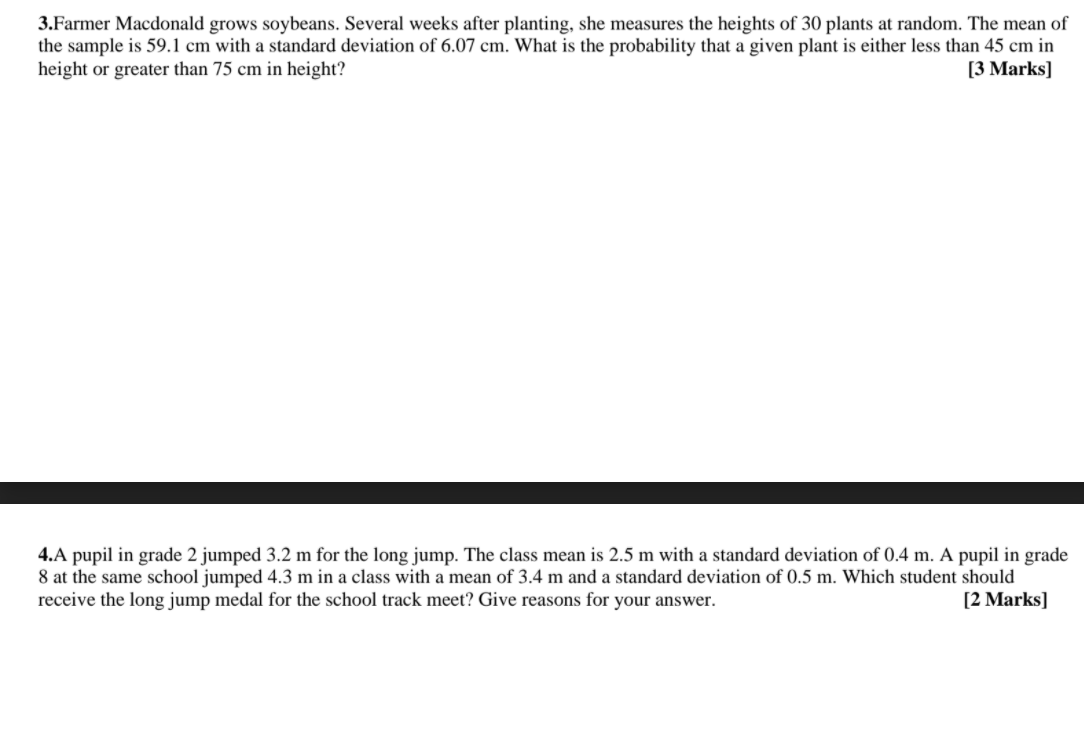
![cm in height or greater than 75 em in height? [3 Marks]](https://s3.amazonaws.com/si.experts.images/answers/2024/06/66787f56b5e97_95066787f568fa47.jpg)

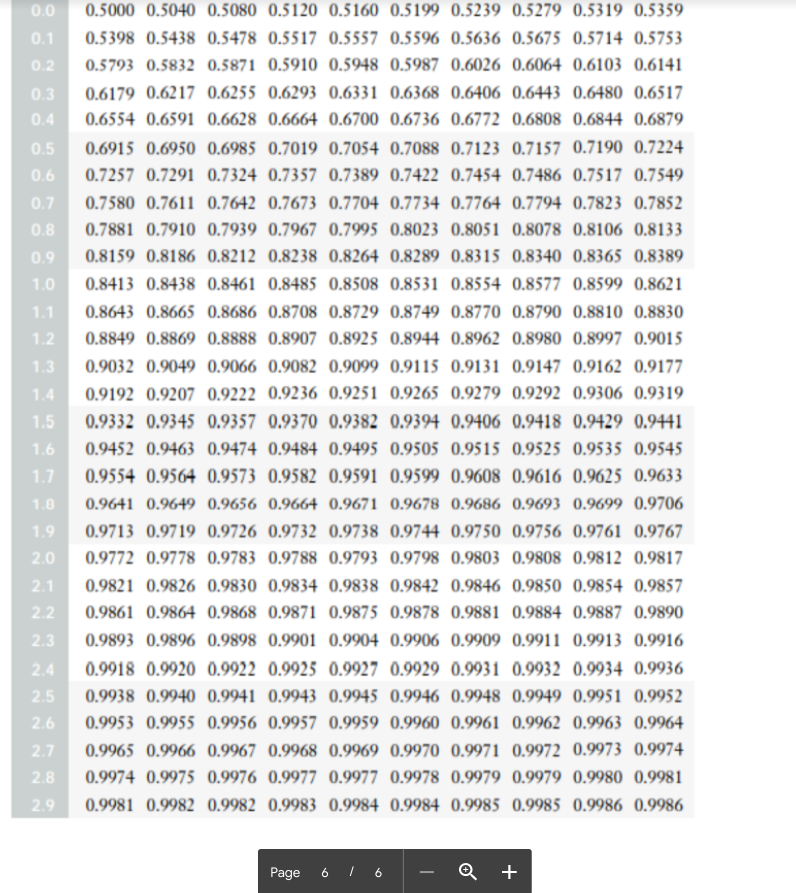
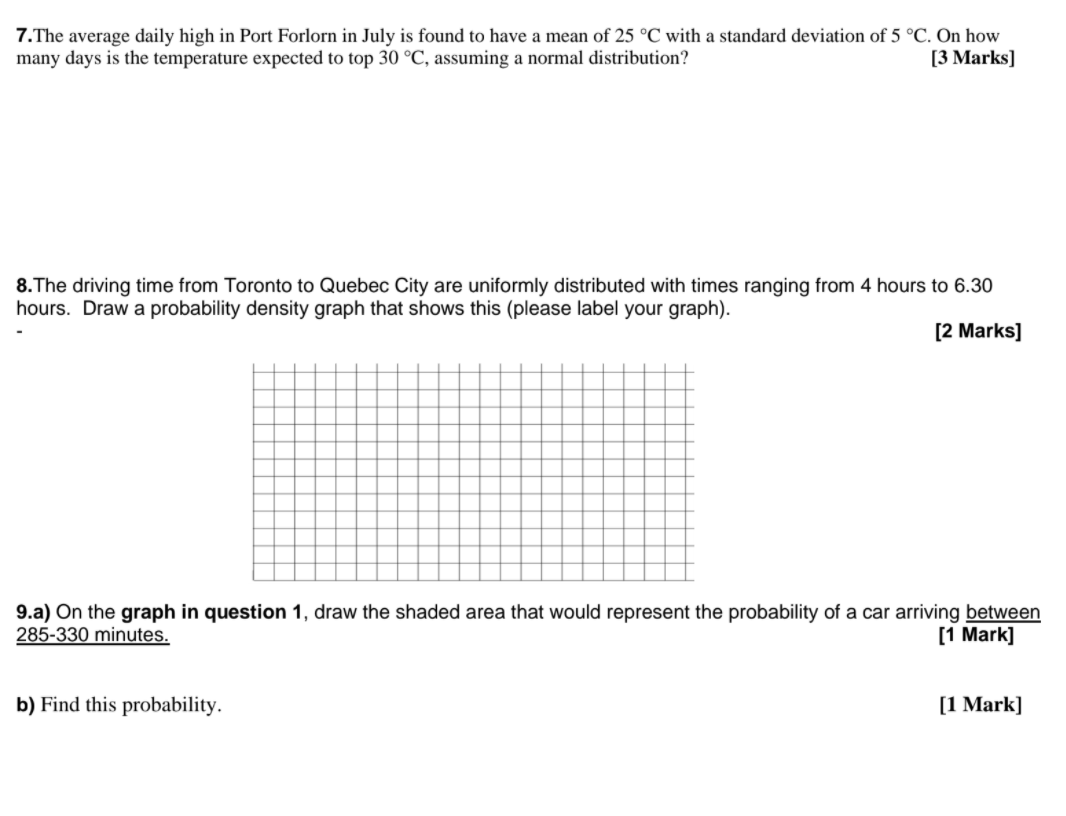
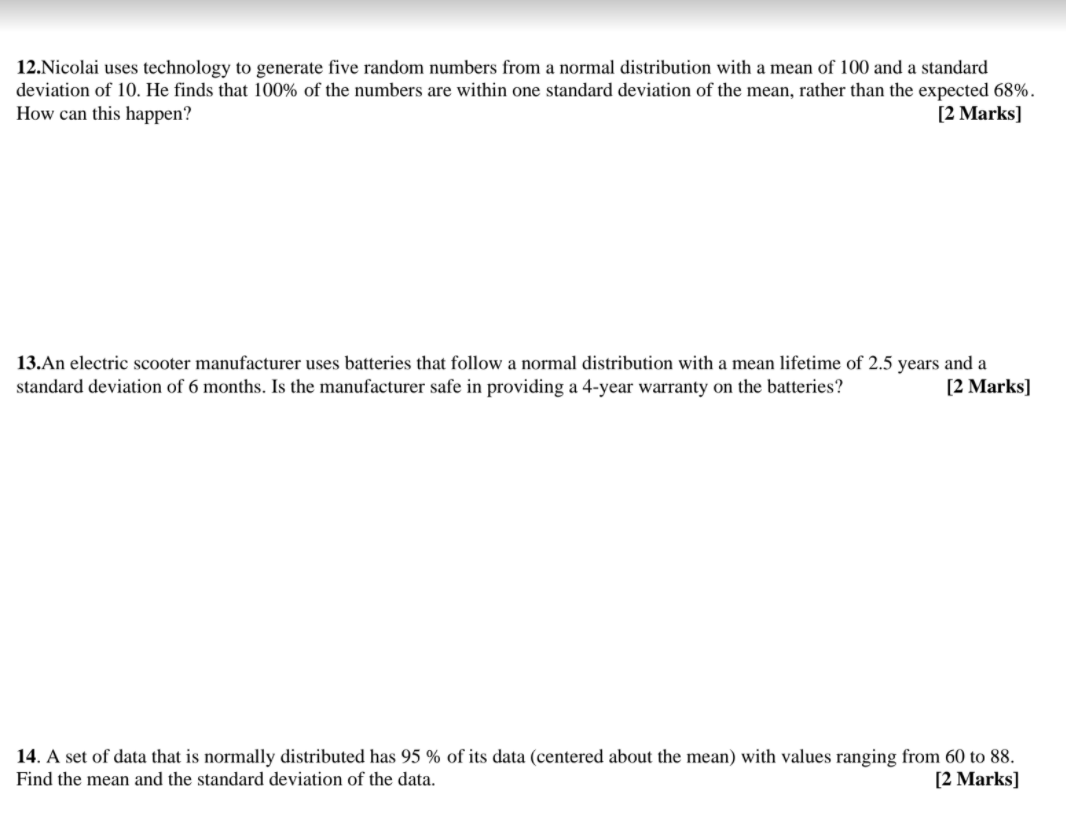
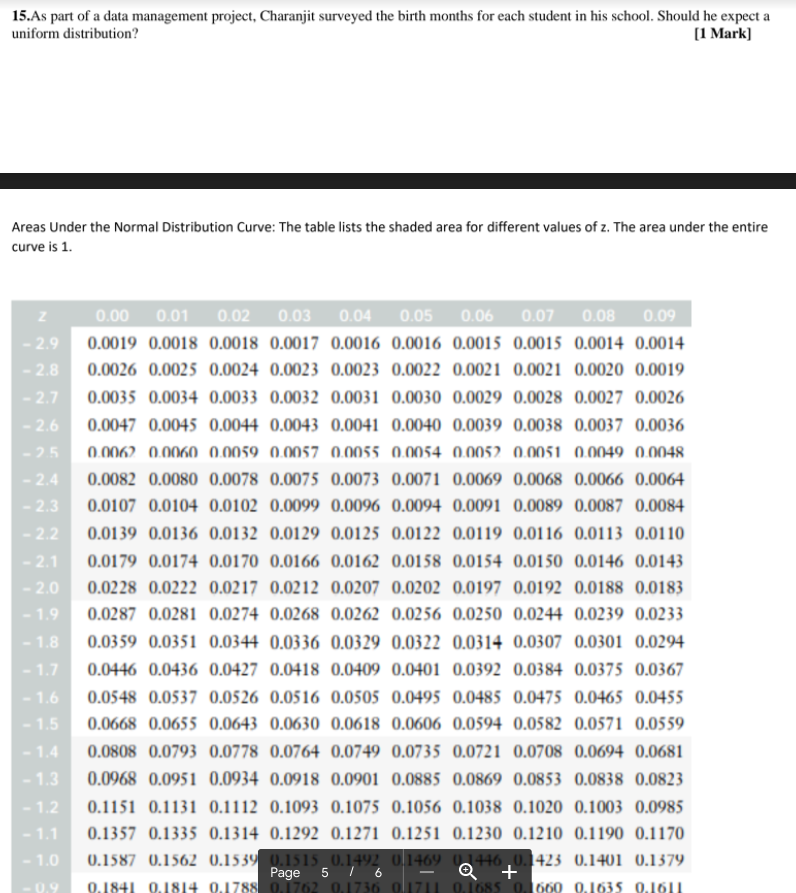
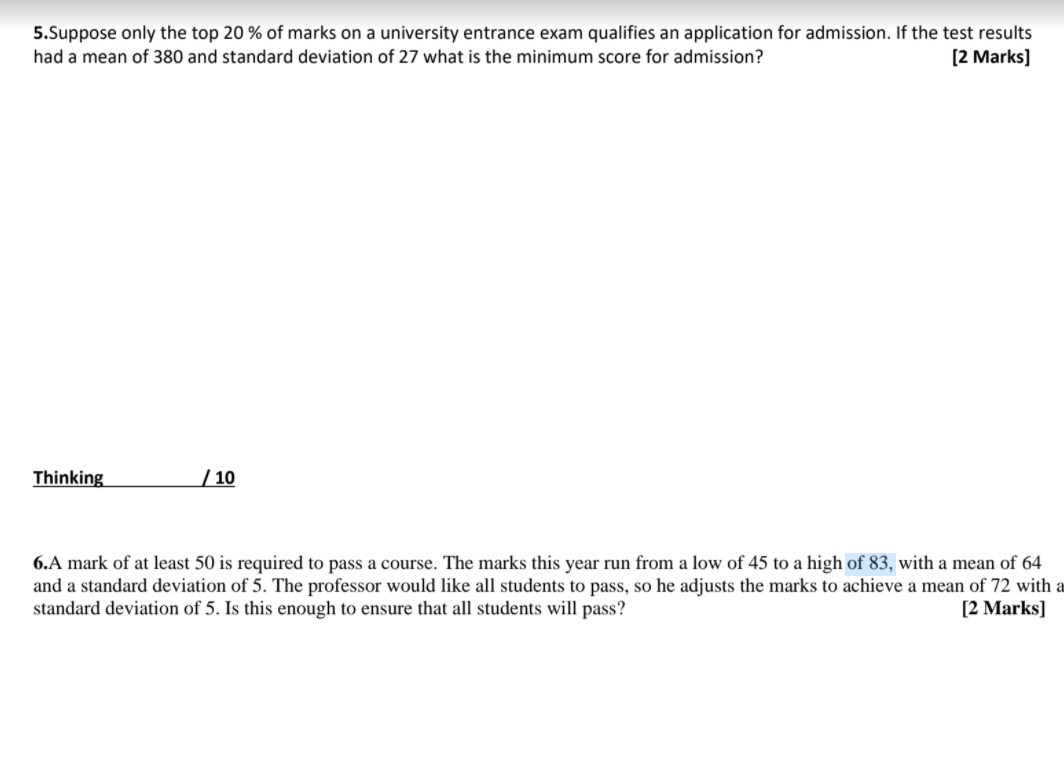
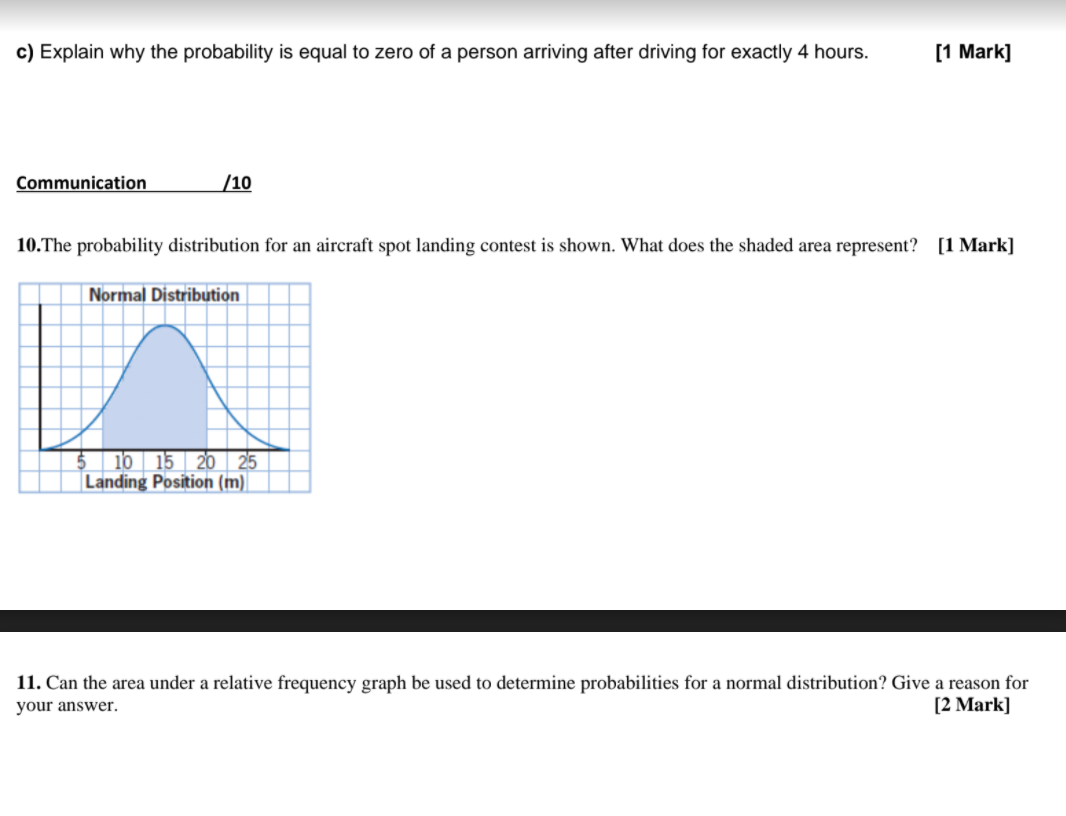
1. The mean mark on a provincial standardized test is 66 with a standard deviation of 10, following a normal distribution. What is the probability that a given student will not achieve a passing mark of at least 50? [1 Mark] 2. The probability density graph shows the number of moves in 20 chess games. What is the probability that a game took between 25 and 35 moves to checkmate? [2 Marks] Chess Moves 0.05 0.04 0.03 Probability Density 0.02 0.01 0 15 25 35 45 55 65 75 Number of Chess Moves3.Farmer Macdonald grows soybeans. Several weeks after planting. she measures the heights of 30 plants at random. The mean of the sample is 59.1 cm with a standard deviation of 6.0? cm. What is the probability that a given plant is either less than 45 cm in height or greater than 75 em in height? [3 Marks] 4.A pupil in grade 2 jumped 3.2 In for the long jump. The class mean is 2.5 m with a standard deviation of 0.4 m. A pupil in grade 8 at the same schooljumped 4.3 m in a class with a mean of 3.4 m and a standard deviation of 0.5 111. Which student should receive the long jump medal for the school track meet? Give reasons for your answer. [2 Marks] 5.5uppose only the top 20 % of marks on a university entrance exam qualies an application for admission. If the test results had a mean of 380 and standard deviation of 27 what is the minimum score for admission? [2 Marks] Thinking [ 3 6A mark of at least 50 is required to pass a course. The marks this year run from a low of 45 to a high of 83. with a mean of 64 and a standard deviation of 5. The professor would like all students to pass. so he adjusts the marks to achieve a mean of 72 with a standard deviation of 5. Is this enough to ensure that all students will pass? [2. Marks] 7.111e- average daily high in Port Forlorn in July is found to have a mean of 25 C with a standard deviation of 5 \"C. On how many days is the temperature expected to top 30 C, assuming a normal distribution? [3 Marks] 8.The driving time irom Toronto to Quebec City are uniformly distributed with times ranging from 4 hours to 6.30 hours. Draw a probability density graph that shows this (please label your graph). _ [2 Marks] ____._ | | I I I I I I Qua) On the graph in question 1. draw the shaded area that would represent the probability ol a car arriving between 285-330 minutes. [1 Mark] b) Find this probability. [1 Mark] c) Explain why the probability is equal to zero of a person arriving after driving for exactly 4 hours. [1 Mark] Communication /10 10.The probability distribution for an aircraft spot landing contest is shown. What does the shaded area represent? [1 Mark] Normal Distribution 5 10 15 20 25 Landing Position (m) 11. Can the area under a relative frequency graph be used to determine probabilities for a normal distribution? Give a reason for your answer. [2 Mark]12.Nieolai uses technology to generate ve random numbers from a normal distribution with a mean of 100 and a standard deviation of 10. He nds that 100% of the numbers are within one standard deviation of the mean, rather than the expected 68%. How can this happen? [2 Marks] 13.An electric scooter manufacturer uses batteries that follow a normal distribution with a mean lifetime of 2.5 years and a standard deviation of 6 months. Is the manufacturer safe in providing a 4-year warranty on the batteries? [2 Marks] 14. A set of data that is normally distributed has 95 96 of its data (centered about the mean) with values ranging from 60 to 88. Find the mean and the standard deviation of the data. [2 Marks] 15.As part of a data management project, Charanjit surveyed the birth months for each student in his school. Should he expect a uniform distribution? [1 Mark] Areas Under the Normal Distribution Curve: The table lists the shaded area for different values of z. The area under the entire curve is 1. 0.00 0.01 0.02 0.03 0.04 0.05 0.06 0.07 0.08 0.09 - 2.9 0.0019 0.0018 0.0018 0.0017 0.0016 0.0016 0.0015 0.0015 0.0014 0.0014 - 2.8 0.0026 0.0025 0.0024 0.0023 0.0023 0.0022 0.0021 0.0021 0.0020 0.0019 - 2.7 0.0035 0.0034 0.0033 0.0032 0.0031 0.0030 0.0029 0.0028 0.0027 0.0026 - 2.6 0.0047 0.0045 0.0044 0.0043 0.0041 0.0040 0.0039 0.0038 0.0037 0.0036 - 25 0.0062 0.0060 0.0059 0.0057 0.0055 0.0054 0.0052 0.0051 0.0049 0.0048 - 2.4 0.0082 0.0080 0.0078 0.0075 0.0073 0.0071 0.0069 0.0068 0.0066 0.0064 - 2.3 0.0107 0.0104 0.0102 0.0099 0.0096 0.0094 0.0091 0.0089 0.0087 0.0084 - 2.2 0.0139 0.0136 0.0132 0.0129 0.0125 0.0122 0.0119 0.0116 0.0113 0.0110 - 2.1 0.0179 0.0174 0.0170 0.0166 0.0162 0.0158 0.0154 0.0150 0.0146 0.0143 - 2.0 0.0228 0.0222 0.0217 0.0212 0.0207 0.0202 0.0197 0.0192 0.0188 0.0183 - 1.9 0.0287 0.0281 0.0274 0.0268 0.0262 0.0256 0.0250 0.0244 0.0239 0.0233 - 1.8 0.0359 0.0351 0.0344 0.0336 0.0329 0.0322 0.0314 0.0307 0.0301 0.0294 1.7 0.0446 0.0436 0.0427 0.0418 0.0409 0.0401 0.0392 0.0384 0.0375 0.0367 1.6 0.0548 0.0537 0.0526 0.0516 0.0505 0.0495 0.0485 0.0475 0.0465 0.0455 - 1.5 0.0668 0.0655 0.0643 0.0630 0.0618 0.0606 0.0594 0.0582 0.0571 0.0559 1.4 0.0808 0.0793 0.0778 0.0764 0.0749 0.0735 0.0721 0.0708 0.0694 0.0681 1.3 0.0968 0.0951 0.0934 0.0918 0.0901 0.0885 0.0869 0.0853 0.0838 0.0823 1.2 0.1151 0.1131 0.1112 0.1093 0.1075 0.1056 0.1038 0.1020 0.1003 0.0985 1.1 0.1357 0.1335 0.1314 0.1292 0.1271 0.1251 0.1230 0.1210 0.1190 0.1170 1.0 0.1587 0.1562 0.1539 423 0.1401 0.1379 Page 1841 1635
Step by Step Solution
There are 3 Steps involved in it

Get step-by-step solutions from verified subject matter experts