

Question: Answer based on the code above: import numpy as np import matplotlib.pyplot as plt from mpl _ toolkits.mplot 3 d import Axes 3 D #
Answer based on the code above:
import numpy as np import matplotlib.pyplot as plt from mpltoolkits.mplotd import AxesD # Define the function fx that models the vase's profile def vaseprofilex: # Example: a quadratic profile with a flared top return x # fxx # Set up the range of x eg height of the vase, in cm x nplinspace # x ranges from cm to cm y vaseprofilex # Plot the D profile of the vase pltfigurefigsize pltplotx y label'Vase Profile fx color'blue' plttitleD Profile of the Vase" pltxlabelRadius cm pltylabelHeight cm pltaxhline color'black', linewidth pltaxvline color'black', linewidth pltlegend pltgrid pltshow # Generate the solid of revolution X nplinspace Y vaseprofileX theta nplinspace nppi # Revolve around yaxis X Theta npmeshgridX theta Y vaseprofileX Z X npcosTheta R X npsinTheta # D plot of the solid of revolution fig pltfigurefigsize ax fig.addsubplot projectiond axplotsurfaceZ R Y cmap'viridis', edgecolork alpha axsettitleSolid of Revolution of the Vase" axsetxlabelX cm axsetylabelZ cm axsetzlabelHeight cm pltshow
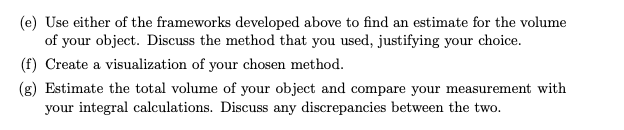
e Use either of the frameworks developed above to find an estimate for the volume
of your object. Discuss the method that you used, justifying your choice.
f Create a visualization of your chosen method.
g Estimate the total volume of your object and compare your measurement with
your integral calculations. Discuss any discrepancies between the two.
Step by Step Solution
There are 3 Steps involved in it
1 Expert Approved Answer
Step: 1 Unlock

Question Has Been Solved by an Expert!
Get step-by-step solutions from verified subject matter experts
Step: 2 Unlock
Step: 3 Unlock