

Question: answer both, please. easy ones please be quick , I'll uprate 31 Q31a The box plots represent the distances run by the players in a
answer both, please. easy ones please be quick , I'll uprate
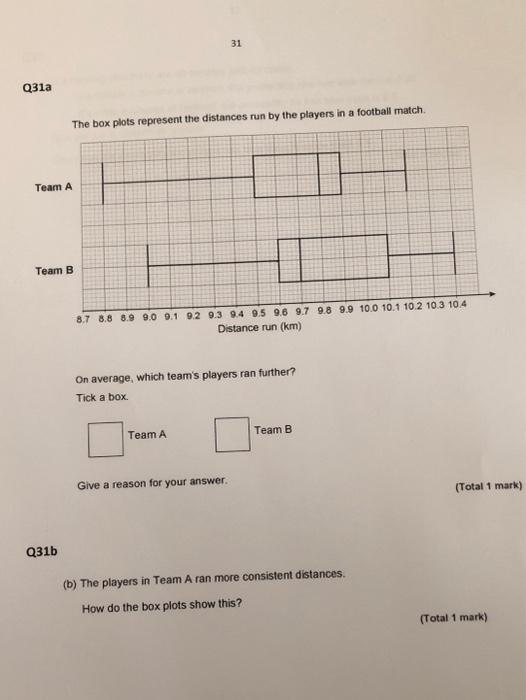
31 Q31a The box plots represent the distances run by the players in a football match. Team A Team B 87 8.8 8.9 9.0 9.1 92 9.3 94 95 9.6 97 98 9.9 10.0 10.1 10.2 10.3 104 Distance run (km) On average, which team's players ran further? Tick a box. Team A Team B Give a reason for your answer. (Total 1 mark) Q31b (b) The players in Team A ran more consistent distances. How do the box plots show this? (Total 1 mark)
Step by Step Solution
There are 3 Steps involved in it
1 Expert Approved Answer
Step: 1 Unlock

Question Has Been Solved by an Expert!
Get step-by-step solutions from verified subject matter experts
Step: 2 Unlock
Step: 3 Unlock