

Question: ANSWER C AND D WITH YOUR WORK. Expert Q&A Done 2. Forecasting (Total 25 points) 788 Columbus Municipal Government has asked you to forecast the
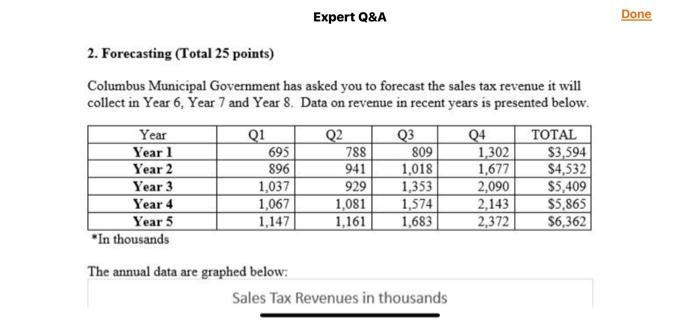
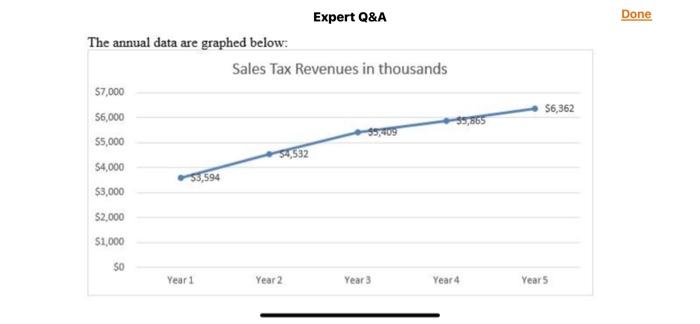
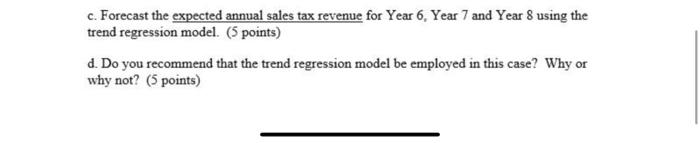
Expert Q&A Done 2. Forecasting (Total 25 points) 788 Columbus Municipal Government has asked you to forecast the sales tax revenue it will collect in Year 6. Year 7 and Year 8. Data on revenue in recent years is presented below. Year Q1 Q2 Q3 04 TOTAL Year 1 695 809 1,302 $3,594 Year 2 896 941 1,018 1,677 $4,532 Year 3 1,037 929 1,353 2,090 $5,409 Year 4 1,067 1,081 1,574 2.143 $5,865 Year 5 1,147 1,161 1,683 2,372 $6,362 "In thousands The annual data are graphed below: Sales Tax Revenues in thousands Done Expert Q&A The annual data are graphed below: Sales Tax Revenues in thousands $7,000 S6,000 55,000 56,362 35,865 54532 $4,000 53.594 $3,000 $2,000 51,000 SO Year 1 Year 2 Year Year 4 Year 5 c. Forecast the expected annual sales tax revenue for Year 6. Year 7 and Year 8 using the trend regression model. (5 points) d. Do you recommend that the trend regression model be employed in this case? Why or why not? (5 points) Expert Q&A Done 2. Forecasting (Total 25 points) 788 Columbus Municipal Government has asked you to forecast the sales tax revenue it will collect in Year 6. Year 7 and Year 8. Data on revenue in recent years is presented below. Year Q1 Q2 Q3 04 TOTAL Year 1 695 809 1,302 $3,594 Year 2 896 941 1,018 1,677 $4,532 Year 3 1,037 929 1,353 2,090 $5,409 Year 4 1,067 1,081 1,574 2.143 $5,865 Year 5 1,147 1,161 1,683 2,372 $6,362 "In thousands The annual data are graphed below: Sales Tax Revenues in thousands Done Expert Q&A The annual data are graphed below: Sales Tax Revenues in thousands $7,000 S6,000 55,000 56,362 35,865 54532 $4,000 53.594 $3,000 $2,000 51,000 SO Year 1 Year 2 Year Year 4 Year 5 c. Forecast the expected annual sales tax revenue for Year 6. Year 7 and Year 8 using the trend regression model. (5 points) d. Do you recommend that the trend regression model be employed in this case? Why or why not? (5 points)
Step by Step Solution
There are 3 Steps involved in it

Get step-by-step solutions from verified subject matter experts