

Question: EXPLAIN AND SHOW YOUR WORK 2. Forecasting (Total 25 points) Columbus Municipal Government has asked you to forecast the sales tax revenue it will collect
EXPLAIN AND SHOW YOUR WORK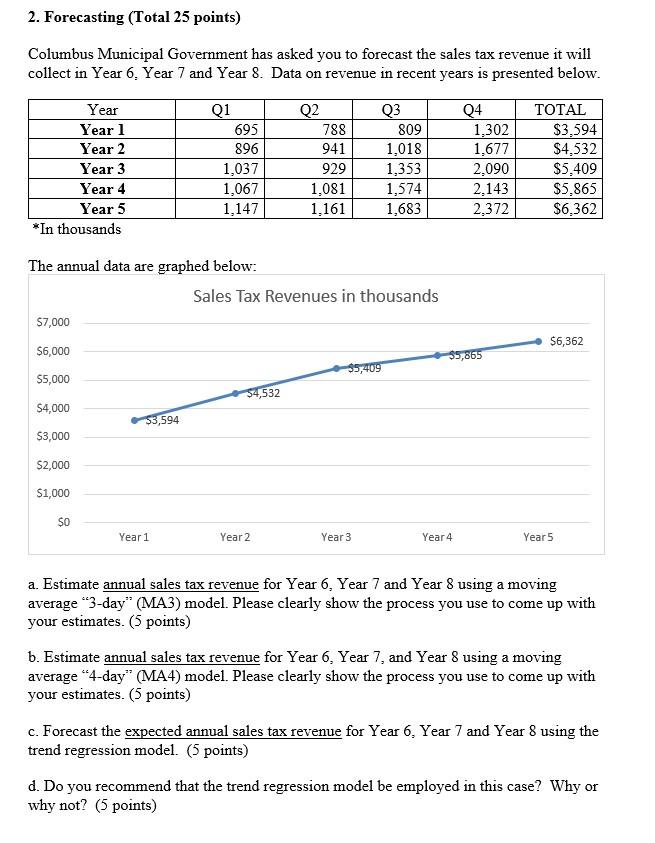
2. Forecasting (Total 25 points) Columbus Municipal Government has asked you to forecast the sales tax revenue it will collect in Year 6. Year 7 and Year 8. Data on revenue in recent years is presented below. Year Year 1 Year 2 Year 3 Year 4 Year 5 *In thousands Q1 695 896 1,037 1,067 1,147 Q2 788 941 929 1,081 1.161 Q3 809 1,018 1,353 1,574 1,683 Q4 1,302 1,677 2,090 2.143 2.372 TOTAL $3,594 $4,532 $5,409 $5,865 $6,362 The annual data are graphed below: Sales Tax Revenues in thousands 57,000 $6,362 $6,000 $5,865 35,409 $5,000 $4,532 $4,000 $3,594 $3,000 $2,000 $1,000 $0 Year 1 Year 2 Year 3 Year 4 Year 5 a. Estimate annual sales tax revenue for Year 6. Year 7 and Year 8 using a moving average "3-day" (MA3) model. Please clearly show the process you use to come up with your estimates. (5 points) b. Estimate annual sales tax revenue for Year 6. Year 7, and Year 8 using a moving average "4-day" (MA4) model. Please clearly show the process you use to come up with your estimates. (5 points) c. Forecast the expected annual sales tax revenue for Year 6. Year 7 and Year 8 using the trend regression model. (5 points) d. Do you recommend that the trend regression model be employed in this case? Why or why not? (5 points)
Step by Step Solution
There are 3 Steps involved in it

Get step-by-step solutions from verified subject matter experts