

Question: Answer EVERYTHING in green 1 Probability Distribution The probability distribution is a listing of all possible outcomes and the corresponding probability. 1. Probability Distributions: Calculate
Answer EVERYTHING in green
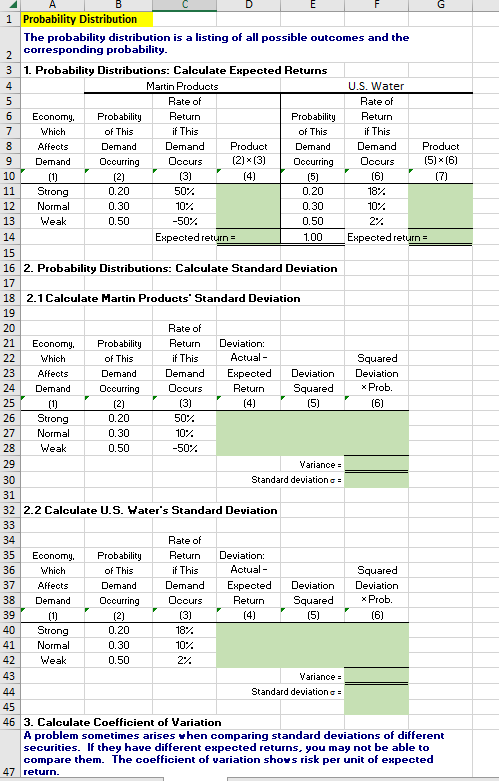
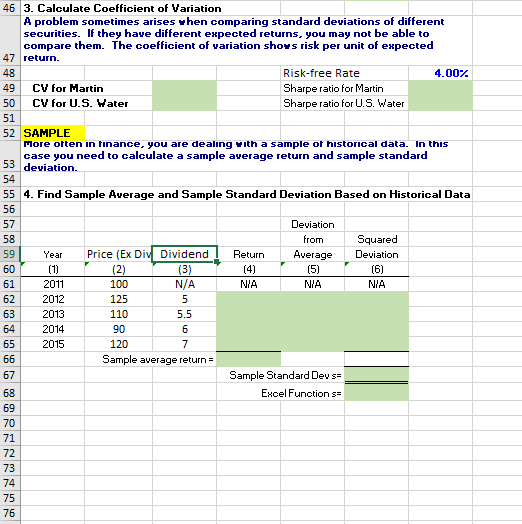
1 Probability Distribution The probability distribution is a listing of all possible outcomes and the corresponding probability. 1. Probability Distributions: Calculate Expected Returns 2. Probability Distributions: Calculate Standard Deviation 2.1Calculate Martin Products" Standard Deviation \begin{tabular}{l|l|c|c|c|c|c|} \hline 19 & & & & & \\ 20 & & & Rate of & & & \\ \hline 21 & Economy. & Frobability & Return & Deviation: & & \\ 22 & Which & of This & if This & Actual & & Squared \\ 23 & Affects & Demand & Demand & Expected & Deviation & Deviation \\ \hline 24 & Demand & Deccurring & Docurs & Return & Squared & Prob. \\ 25 & (1) & (2) & (3) & (4) & (5) & (6) \\ \hline 26 & Strong & 0.20 & 50% & & & \\ \hline 27 & Normal & 0.30 & 10% & & & \\ 28 & Weak & 0.50 & 50% & & & \\ \hline 29 & & & & & Variance = \\ \hline \hline \end{tabular} Standard deviation = 2.2 Calculate U.S. Hater's Standard Deviation \begin{tabular}{l|c|c|c|c|c|c|} \hline 33 & & & & & \\ \hline 34 & & & Rate of & & & \\ 35 & Economy. & Probability & Return & Deviation: & & \\ \hline 36 & Which & of This & if This & Actual- & & Squared \\ \hline 37 & Affects & Demand & Demand & Expected & Deviation & Deviation \\ 38 & Demand & Oecurring & Decurs & Return & Squared & Prob. \\ \hline 39 & (1) & (2) & (3) & (4) & (5) & (6) \\ \hline 40 & Strong & 0.20 & 18% & & & \\ 441 & Normal & 0.30 & 10% & & & \\ \hline 42 & Weak & 0.50 & 2% & & & \\ \hline 43 & & & & & Variance = \\ \hline 44 & & & & Standard deviation = \\ \hline 5 & & & & & \end{tabular} 3. Calculate Coefficient of Variation A problem sometimes arises when comparing standard deviations of different securities. If they have different expected returns, you may not be able to compare them. The coefficient of yariation shovs risk per unit of expected 6 3. Calculate Coefficient of Variation A problem sometimes arises when comparing standard deviations of different securities. If they have different expected returns, you may not be able to compare them. The coefficient of wariation shows risk per unit of expected 7 return
Step by Step Solution
There are 3 Steps involved in it

Get step-by-step solutions from verified subject matter experts