

Question: answer fast pls Figure 1 The vertical distance between points A and B represents a tax in the market. Price 12- 11 10 Supply Demand
answer fast pls
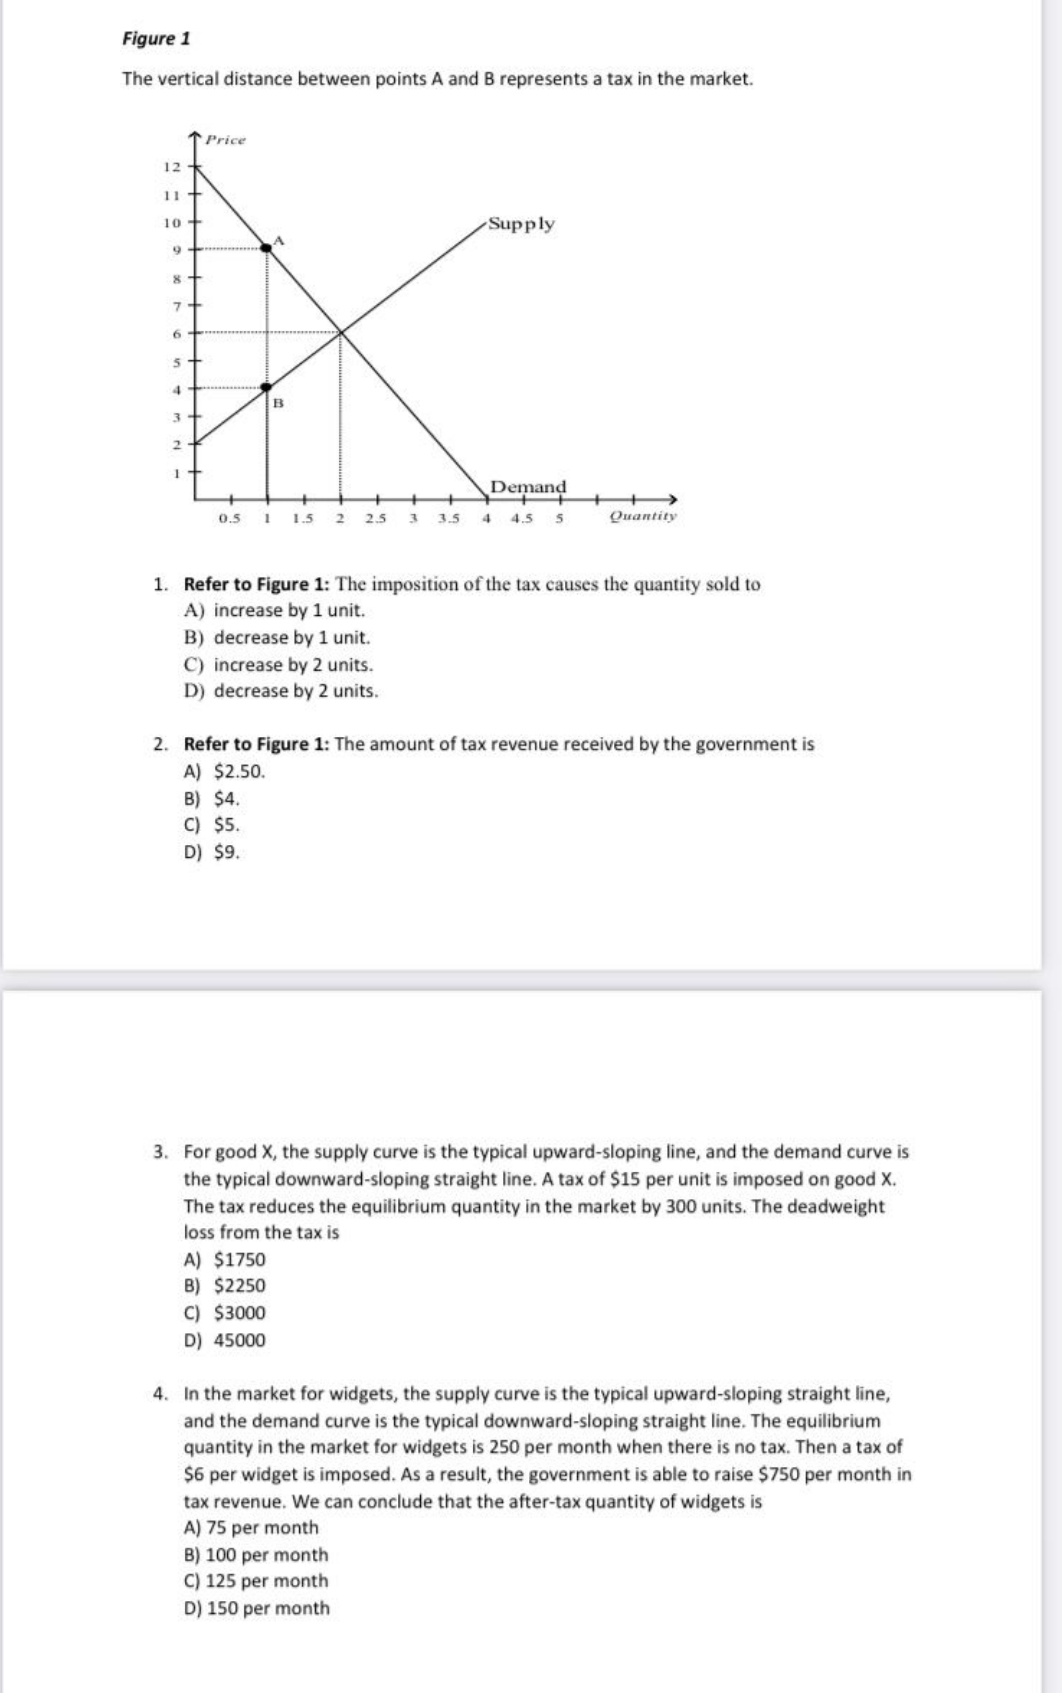
Figure 1 The vertical distance between points A and B represents a tax in the market. Price 12- 11 10 Supply Demand 0.5 4.5 Quantity 1. Refer to Figure 1: The imposition of the tax causes the quantity sold to A) increase by 1 unit. B) decrease by 1 unit. C) increase by 2 units. D) decrease by 2 units. 2. Refer to Figure 1: The amount of tax revenue received by the government is A) $2.50. B) $4. C) $5. D) $9. 3. For good X, the supply curve is the typical upward-sloping line, and the demand curve is the typical downward-sloping straight line. A tax of $15 per unit is imposed on good X. The tax reduces the equilibrium quantity in the market by 300 units. The deadweight loss from the tax is A) $1750 B) $2250 C) $3000 D) 45000 4. In the market for widgets, the supply curve is the typical upward-sloping straight line, and the demand curve is the typical downward-sloping straight line. The equilibrium quantity in the market for widgets is 250 per month when there is no tax. Then a tax of $6 per widget is imposed. As a result, the government is able to raise $750 per month in tax revenue. We can conclude that the after-tax quantity of widgets is A) 75 per month B) 100 per month C) 125 per month D) 150 per month
Step by Step Solution
There are 3 Steps involved in it

Get step-by-step solutions from verified subject matter experts