

Question: answer in detail please how to figure which chart to use How do Governments spend the tax dollars they collect and has the this changed
answer in detail please how to figure which chart to use
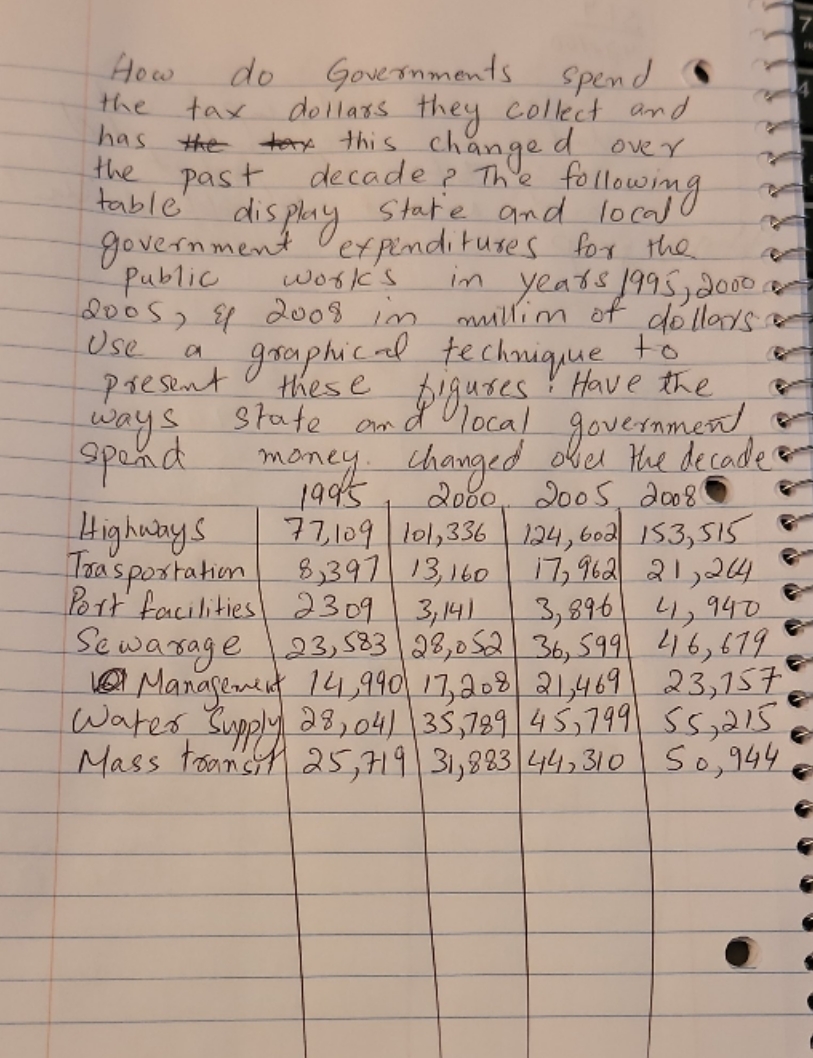
How do Governments spend the tax dollars they collect and has the this changed over the past decade ? The following table display state and local government expenditures for the Public work's in years 1995 , 2000 . 20 0 5 , 8 2008 in mullin of dollars Use a graphical technique to presentthese figures ! Have the ways state and local government . spend money. changed over the decades 19 95 2000 2005 2008 Highways 77, 109 101, 336 124, 602 153, 515 Toa sportation 8, 397 13, 160 17, 962 21 , 264 Port facilities 2309 3 , 14 1 3 , 896 41 940 Sewarage | 23, 583 28,052 36, 599 46 , 679 1@Management 14, 990) 17, 208 21,469 23 , 757 Water Supply 28, 041 35, 789 45, 799) 55, 215 . Mass transit 25, 719 31, 883 44, 310 50, 944
Step by Step Solution
There are 3 Steps involved in it

Get step-by-step solutions from verified subject matter experts