

Question: Answer is given. i need a step by step for each answer. Refer to the table Eactors for Computing Control Chart Limits.(3.sigma) for this problem
Answer is given. i need a step by step for each answer. 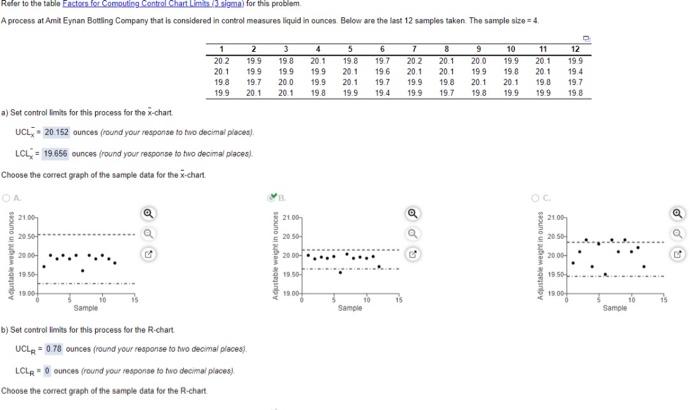
Refer to the table Eactors for Computing Control Chart Limits.(3.sigma) for this problem A process at Amit Eynan Bottling Company that is considered in control measures liquid in ounces. Below are the last 12 samples taken. The sample size=4 a) Set control limits for this process for the x-chart. UCL, 20.152 ounces (round your response to two decimal places) LCL = 19.656 ounces (round your response to two decimal places) Choose the correct graph of the sample data for the x-chart. OA sono una agen 21.00 20.50 2000- 19.50- 19.00 7 11 12 1 2 3 4 5 6 8 9 10 20.2 19.9 19.8 20.1 19.8 19.7 20.2 20.1 20.0 19.9 20.1 19.9 20.1 19.9 19.9 19.9 20.1 19.6 20.1 20.1 19.9 19.8 20.1 19.4 19.8 19.7 20.0 19.9 20.1 19.7 19.9 19.8 20.1 20.1 19.8 19.7 19.9 20.1 20.1 19.8 19.9 19.4 19.9 19.7 19.8 19.8 19.9 19.9 Sample b) Set control limits for this process for the R-chart UCL = 0.78 ounces (round your response to two decimal places) LCL 0 ounces (round your response to two decimal places) Choose the correct graph of the sample data for the R-chart Adjustable weight in ounces 21.00 20.50 20 00 19.50- 19.00 ... .... 10 Sample Adjustable weight in ounces 21.00 20.50 20.00- 19.50 O 19.00 Sample 10 15 Step by Step Solution
There are 3 Steps involved in it
1 Expert Approved Answer
Step: 1 Unlock

Question Has Been Solved by an Expert!
Get step-by-step solutions from verified subject matter experts
Step: 2 Unlock
Step: 3 Unlock