

Question: Answer on excel, please. 1. You have decided to evaluate the following three corporate bonds to include in your portfolio: Settlement Date Maturity Date Frequency
Answer on excel, please.
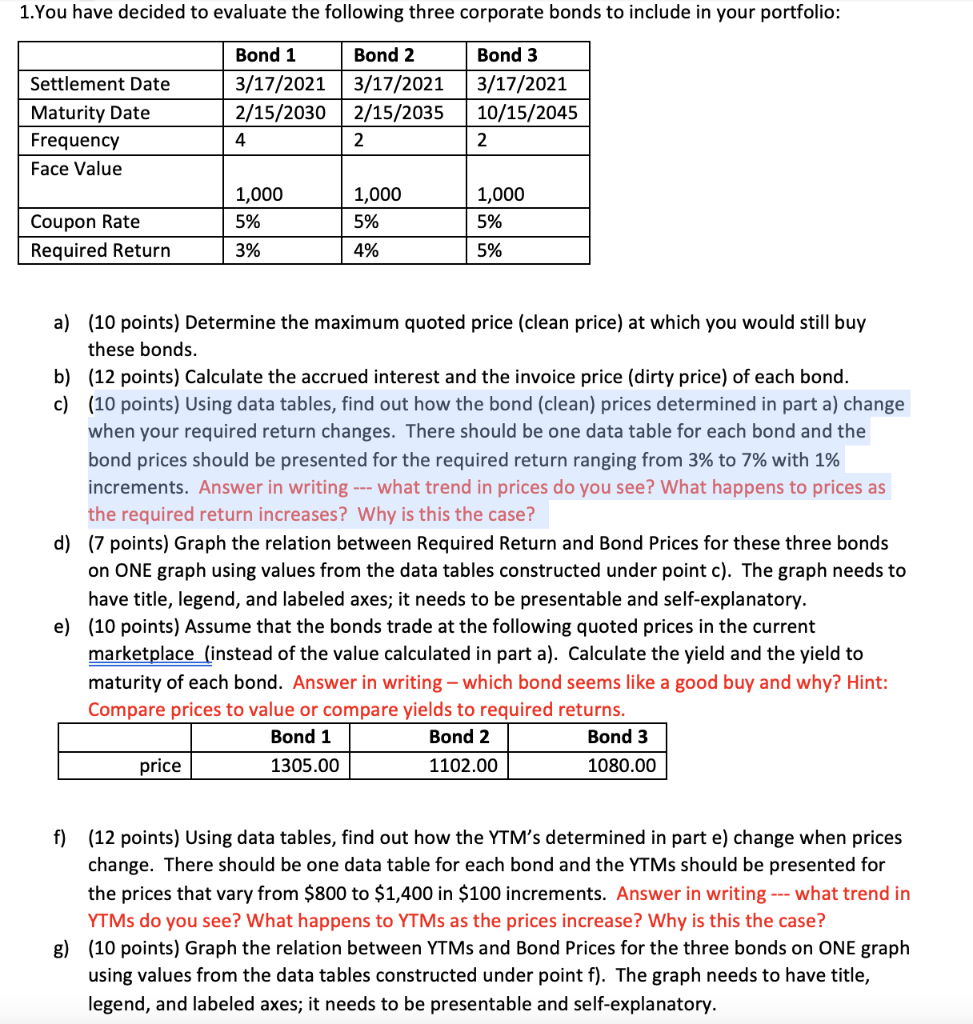
1. You have decided to evaluate the following three corporate bonds to include in your portfolio: Settlement Date Maturity Date Frequency Face Value Bond 1 3/17/2021 2/15/2030 4 Bond 2 3/17/2021 2/15/2035 2 Bond 3 3/17/2021 10/15/2045 2 1,000 5% 1,000 5% 1,000 5% Coupon Rate Required Return 3% 4% 5% a) (10 points) Determine the maximum quoted price (clean price) at which you would still buy these bonds. b) (12 points) Calculate the accrued interest and the invoice price (dirty price) of each bond. c) (10 points) Using data tables, find out how the bond (clean) prices determined in part a) change when your required return changes. There should be one data table for each bond and the bond prices should be presented for the required return ranging from 3% to 7% with 1% increments. Answer in writing --- what trend in prices do you see? What happens to prices as the required return increases? Why is this the case? d) (7 points) Graph the relation between Required Return and Bond Prices for these three bonds on ONE graph using values from the data tables constructed under point c). The graph needs to have title, legend, and labeled axes; it needs to be presentable and self-explanatory. e) (10 points) Assume that the bonds trade at the following quoted prices in the current marketplace (instead of the value calculated in part a). Calculate the yield and the yield to maturity of each bond. Answer in writing - which bond seems like a good buy and why? Hint: Compare prices to value or compare yields to required returns. Bond 1 Bond 2 Bond 3 price 1305.00 1102.00 1080.00 f) (12 points) Using data tables, find out how the YTM's determined in part e) change when prices change. There should be one data table for each bond and the YTMs should be presented for the prices that vary from $800 to $1,400 in $100 increments. Answer in writing --- what trend in YTMs do you see? What happens to YTMs as the prices increase? Why is this the case? g) (10 points) Graph the relation between YTMs and Bond Prices for the three bonds on ONE graph using values from the data tables constructed under point f). The graph needs to have title, legend, and labeled axes; it needs to be presentable and self-explanatory
Step by Step Solution
There are 3 Steps involved in it

Get step-by-step solutions from verified subject matter experts