

Question: Please only answer #2, Second picture. And please show work in excel 1.You haye decided to evaluate the following three corporate bonds to include in
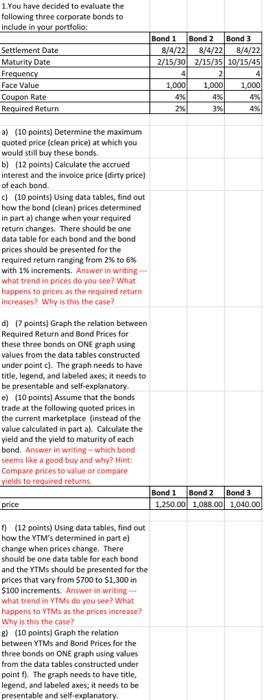
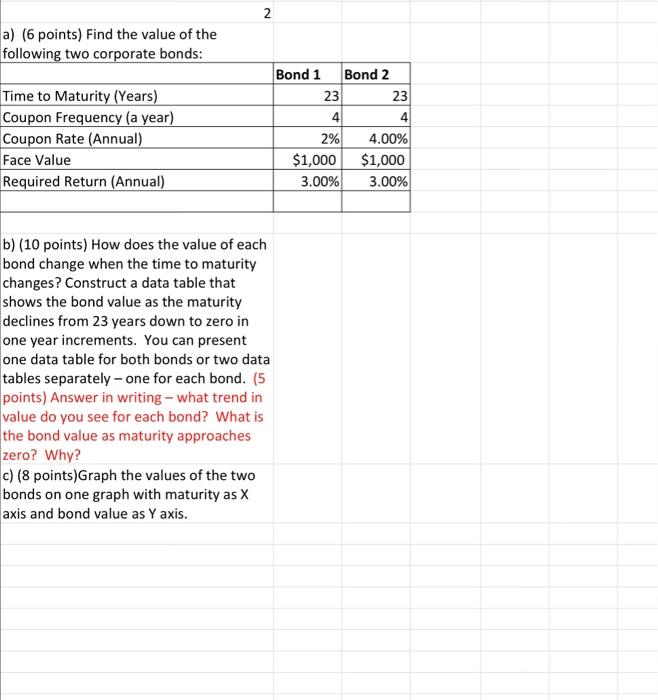
1.You haye decided to evaluate the following three corporate bonds to include in vour oortfolio: a) (10 points) Determine the maximum quoted price (clean price) at which you would still buy these bonds. b) (12 points) Calculate the accrued interest and the invoice price (dirty price) of each bond. c) (10 points) Using data tables, find out how the bond (clean) prices determined in part a) change when your required return changes. There should be one Eata table for each bond and the bond prices should be presented for the required return ranging from 2% to 6% with 1% increments. Answer in writing what thend in prices do you see? What tappens to peices as the required retarn increases? Why is this the case? d) [7 points] Graph the relation between Required Return and Bond Prices for these three bonds on ONE graph using values from the data tables constructed under point c]. The graph needs to have title, legend, and labeled axes; it needs to be presentable and self-explanatory. e) [10 points] Assume that the bonds trade at the following quoted prices in the current marketplace (instead of the value calculated in part a). Calculate the yield and the yield to maturity of each bond. Answer in writing - which bond seems like a good boy and why? Hint. Colmpare perices to vatue of comtigare vields to reauited refusis. f) (12 points) Using data tables, find out how the YTM's determined in part e] change when prices change. There should be one data table for each bond and the YTMs should be presented for the prices that vary from $700 to 51,300 in $100 increments. Answer in writing what trend in YTMs do you see? What happens to YtMs as the prices increase? Why is this the casel? a) (6 points) Find the value of the following two corporate bonds: \begin{tabular}{|l|r|r|} \hline & Bond 1 & Bond 2 \\ \hline Time to Maturity (Years) & 23 & 23 \\ \hline Coupon Frequency (a year) & 4 & 4 \\ \hline Coupon Rate (Annual) & 2% & 4.00% \\ \hline Face Value & $1,000 & $1,000 \\ \hline Required Return (Annual) & 3.00% & 3.00% \\ \hline & & \\ \hline \end{tabular} b) (10 points) How does the value of each bond change when the time to maturity changes? Construct a data table that shows the bond value as the maturity declines from 23 years down to zero in one year increments. You can present one data table for both bonds or two data tables separately - one for each bond. (5 points) Answer in writing - what trend in value do you see for each bond? What is the bond value as maturity approaches zero? Why? c) ( 8 points)Graph the values of the two bonds on one graph with maturity as X axis and bond value as Y axis. 1.You haye decided to evaluate the following three corporate bonds to include in vour oortfolio: a) (10 points) Determine the maximum quoted price (clean price) at which you would still buy these bonds. b) (12 points) Calculate the accrued interest and the invoice price (dirty price) of each bond. c) (10 points) Using data tables, find out how the bond (clean) prices determined in part a) change when your required return changes. There should be one Eata table for each bond and the bond prices should be presented for the required return ranging from 2% to 6% with 1% increments. Answer in writing what thend in prices do you see? What tappens to peices as the required retarn increases? Why is this the case? d) [7 points] Graph the relation between Required Return and Bond Prices for these three bonds on ONE graph using values from the data tables constructed under point c]. The graph needs to have title, legend, and labeled axes; it needs to be presentable and self-explanatory. e) [10 points] Assume that the bonds trade at the following quoted prices in the current marketplace (instead of the value calculated in part a). Calculate the yield and the yield to maturity of each bond. Answer in writing - which bond seems like a good boy and why? Hint. Colmpare perices to vatue of comtigare vields to reauited refusis. f) (12 points) Using data tables, find out how the YTM's determined in part e] change when prices change. There should be one data table for each bond and the YTMs should be presented for the prices that vary from $700 to 51,300 in $100 increments. Answer in writing what trend in YTMs do you see? What happens to YtMs as the prices increase? Why is this the casel? a) (6 points) Find the value of the following two corporate bonds: \begin{tabular}{|l|r|r|} \hline & Bond 1 & Bond 2 \\ \hline Time to Maturity (Years) & 23 & 23 \\ \hline Coupon Frequency (a year) & 4 & 4 \\ \hline Coupon Rate (Annual) & 2% & 4.00% \\ \hline Face Value & $1,000 & $1,000 \\ \hline Required Return (Annual) & 3.00% & 3.00% \\ \hline & & \\ \hline \end{tabular} b) (10 points) How does the value of each bond change when the time to maturity changes? Construct a data table that shows the bond value as the maturity declines from 23 years down to zero in one year increments. You can present one data table for both bonds or two data tables separately - one for each bond. (5 points) Answer in writing - what trend in value do you see for each bond? What is the bond value as maturity approaches zero? Why? c) ( 8 points)Graph the values of the two bonds on one graph with maturity as X axis and bond value as Y axis
Step by Step Solution
There are 3 Steps involved in it

Get step-by-step solutions from verified subject matter experts