

Question: Answer part 2 , Excel steps For Part 1 and 2, using the following demand data over two years and a total of eight quarters.
Answer part 2 , Excel steps
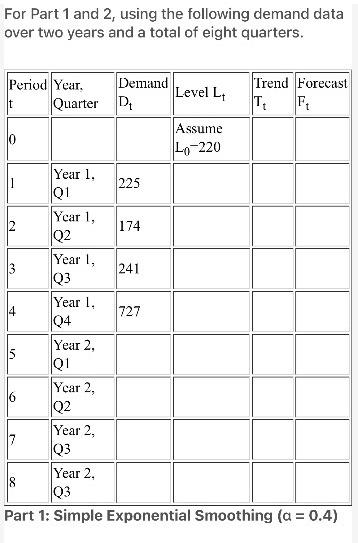
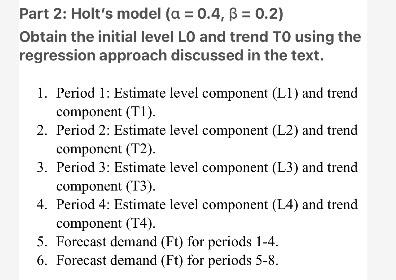
For Part 1 and 2, using the following demand data over two years and a total of eight quarters. Trend Forecast T. Ft Period Year. Demand Level L Quarter D Assume Lo-220 225 174 3 Year 1, 01 Year 1, Q2 Year 1, Q3 Year 1, 04 Year 2, Q1 241 14 727 5 Year 2, 16 Q2 Year 2, Q3 Year 2 18 03 Part 1: Simple Exponential Smoothing (a = 0.4) Part 2: Holt's model (a = 0.4, B = 0.2) Obtain the initial level LO and trend to using the regression approach discussed in the text. 1. Period 1: Estimate level component (L1) and trend component (TI). 2. Period 2: Estimate level component (L2) and trend component (T2). 3. Period 3: Estimate level component (L3) and trend component (T3). 4. Period 4: Estimate level component (L4) and trend component (T4). 5. Forecast demand (Ft) for periods 1-4. 6. Forecast demand (Ft) for periods 5-8 Step by Step Solution
There are 3 Steps involved in it
1 Expert Approved Answer
Step: 1 Unlock

Question Has Been Solved by an Expert!
Get step-by-step solutions from verified subject matter experts
Step: 2 Unlock
Step: 3 Unlock