

Question: answer part a & b for a like Graph/chart The figure in the popup window, shows the one-year retum distribution for RCS stock. Calculate: a.
answer part a & b for a like 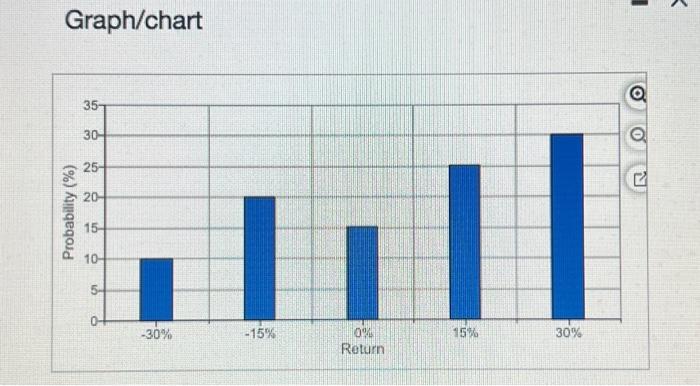
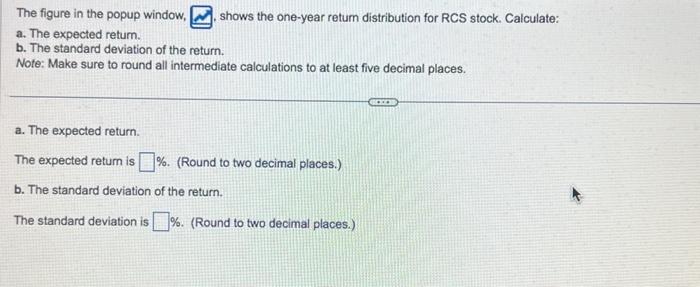
Graph/chart The figure in the popup window, shows the one-year retum distribution for RCS stock. Calculate: a. The expected retum. b. The standard deviation of the return. Note: Make sure to round all intermediate calculations to at least five decimal places. a. The expected return. The expected return is \\%. (Round to two decimal places.) b. The standard deviation of the return. The standard deviation is \\%. (Round to two decimal places.)
Step by Step Solution
There are 3 Steps involved in it
1 Expert Approved Answer
Step: 1 Unlock

Question Has Been Solved by an Expert!
Get step-by-step solutions from verified subject matter experts
Step: 2 Unlock
Step: 3 Unlock