

Question: Answer question 2 with the table given The data provided in tables 1 and 2 below were collected during the culminating lab. Use the data
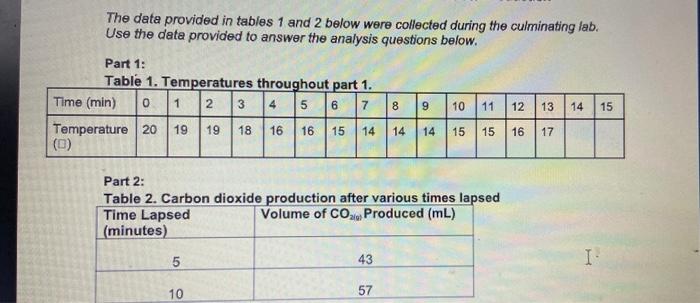
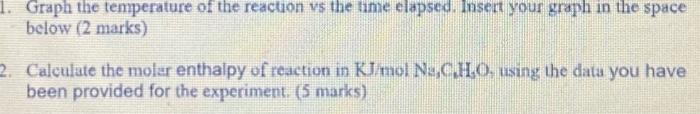
The data provided in tables 1 and 2 below were collected during the culminating lab. Use the data provided to answer the analysis questions below. Part 1: Table 1. Temperatures throughout part 1. Time (min) 0 1 2 3 4 5 6 7 8 9 10 11 12 13 Temperature 20 19 19 18 16 16 15 14 14 14 15 15 (0) 14 15 16 17 Part 2: Table 2. Carbon dioxide production after various times lapsed Time Lapsed Volume of CO2, Produced (mL) (minutes 5 43 I 10 57 1. Graph the temperature of the reaction vs the time clapsed. Insert your graph in the space below (2 marks) 2. Calculate the molar enthalpy of reaction in KJ/mol Nyc.HO. using the data you have been provided for the experiment
Step by Step Solution
There are 3 Steps involved in it

Get step-by-step solutions from verified subject matter experts