

Question: Answer question A Question 1 (Mandatory) (10 points) Use the daily data from MSFT below Price=MSFT adjusted close price ret = the log return A.
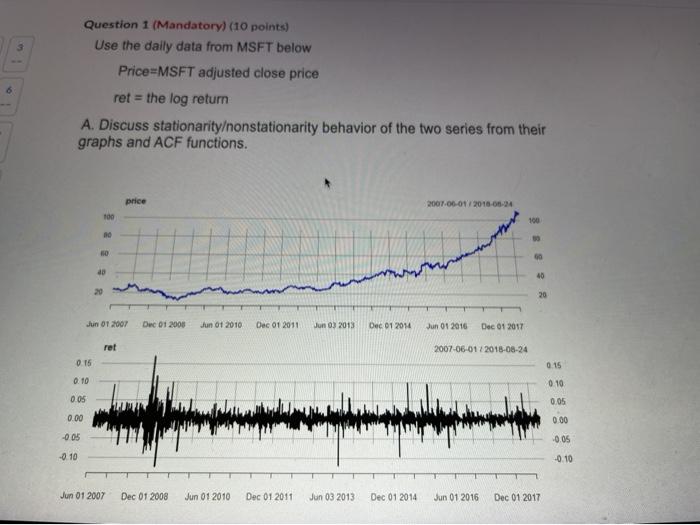
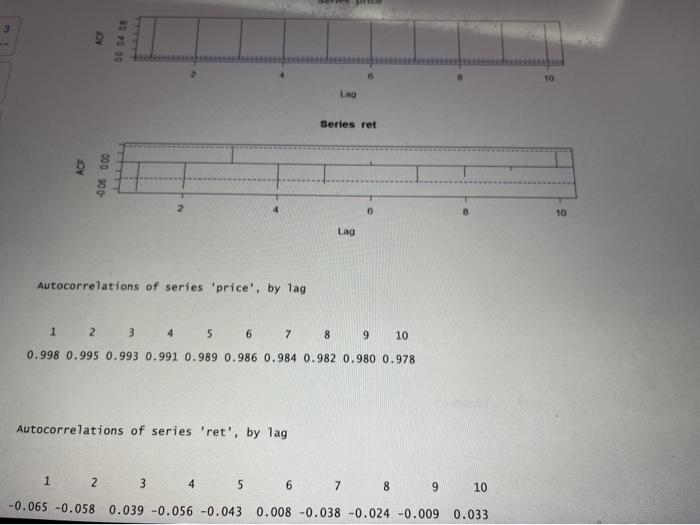
Question 1 (Mandatory) (10 points) Use the daily data from MSFT below Price=MSFT adjusted close price ret = the log return A. Discuss stationarityonstationarity behavior of the two series from their graphs and ACF functions. price 2007.06-01 2018-01-24 100 30 HO 60 30 40 20 20 Jun OT 2007 Dec 01 2000 Jun 01 2010 Dec 01 2011 Jun 0) 2013 Dec 01 2014 Jun 01 2016 Dec 01 2017 ret 2007-06-01 / 2018-08-24 0.15 0.15 0.10 0.10 0.05 0.05 0.00 0.00 -005 -0.05 -0.10 -0.10 Jun 01 2007 Dec 01 2008 Jun 01 2010 Dec 01 2011 Jun 03 2013 Dec 01 2014 Jun 01 2016 Dec 01 2017 3 9 800 09 10 LRG Series ret 6 B 10 Lag Autocorrelations of series 'price', by lag 1 2 3 4 5 6 7 8 9 10 0.998 0.995 0.993 0.991 0.989 0.986 0.984 0.982 0.980 0.978 Autocorrelations of series 'ret', by lag 1 2 3 4 5 6 7 8 9 10 -0.065 -0.058 0.039 -0.056 -0.043 0.008 -0.038 -0.024 -0.009 0.033 Question 1 (Mandatory) (10 points) Use the daily data from MSFT below Price=MSFT adjusted close price ret = the log return A. Discuss stationarityonstationarity behavior of the two series from their graphs and ACF functions. price 2007.06-01 2018-01-24 100 30 HO 60 30 40 20 20 Jun OT 2007 Dec 01 2000 Jun 01 2010 Dec 01 2011 Jun 0) 2013 Dec 01 2014 Jun 01 2016 Dec 01 2017 ret 2007-06-01 / 2018-08-24 0.15 0.15 0.10 0.10 0.05 0.05 0.00 0.00 -005 -0.05 -0.10 -0.10 Jun 01 2007 Dec 01 2008 Jun 01 2010 Dec 01 2011 Jun 03 2013 Dec 01 2014 Jun 01 2016 Dec 01 2017 3 9 800 09 10 LRG Series ret 6 B 10 Lag Autocorrelations of series 'price', by lag 1 2 3 4 5 6 7 8 9 10 0.998 0.995 0.993 0.991 0.989 0.986 0.984 0.982 0.980 0.978 Autocorrelations of series 'ret', by lag 1 2 3 4 5 6 7 8 9 10 -0.065 -0.058 0.039 -0.056 -0.043 0.008 -0.038 -0.024 -0.009 0.033
Step by Step Solution
There are 3 Steps involved in it

Get step-by-step solutions from verified subject matter experts