

Question: answer questions listed on 1st picture 84 Sample Examination Four Section I 8. The histogram shows the ages of cars in the parking lot at
answer questions listed on 1st picture
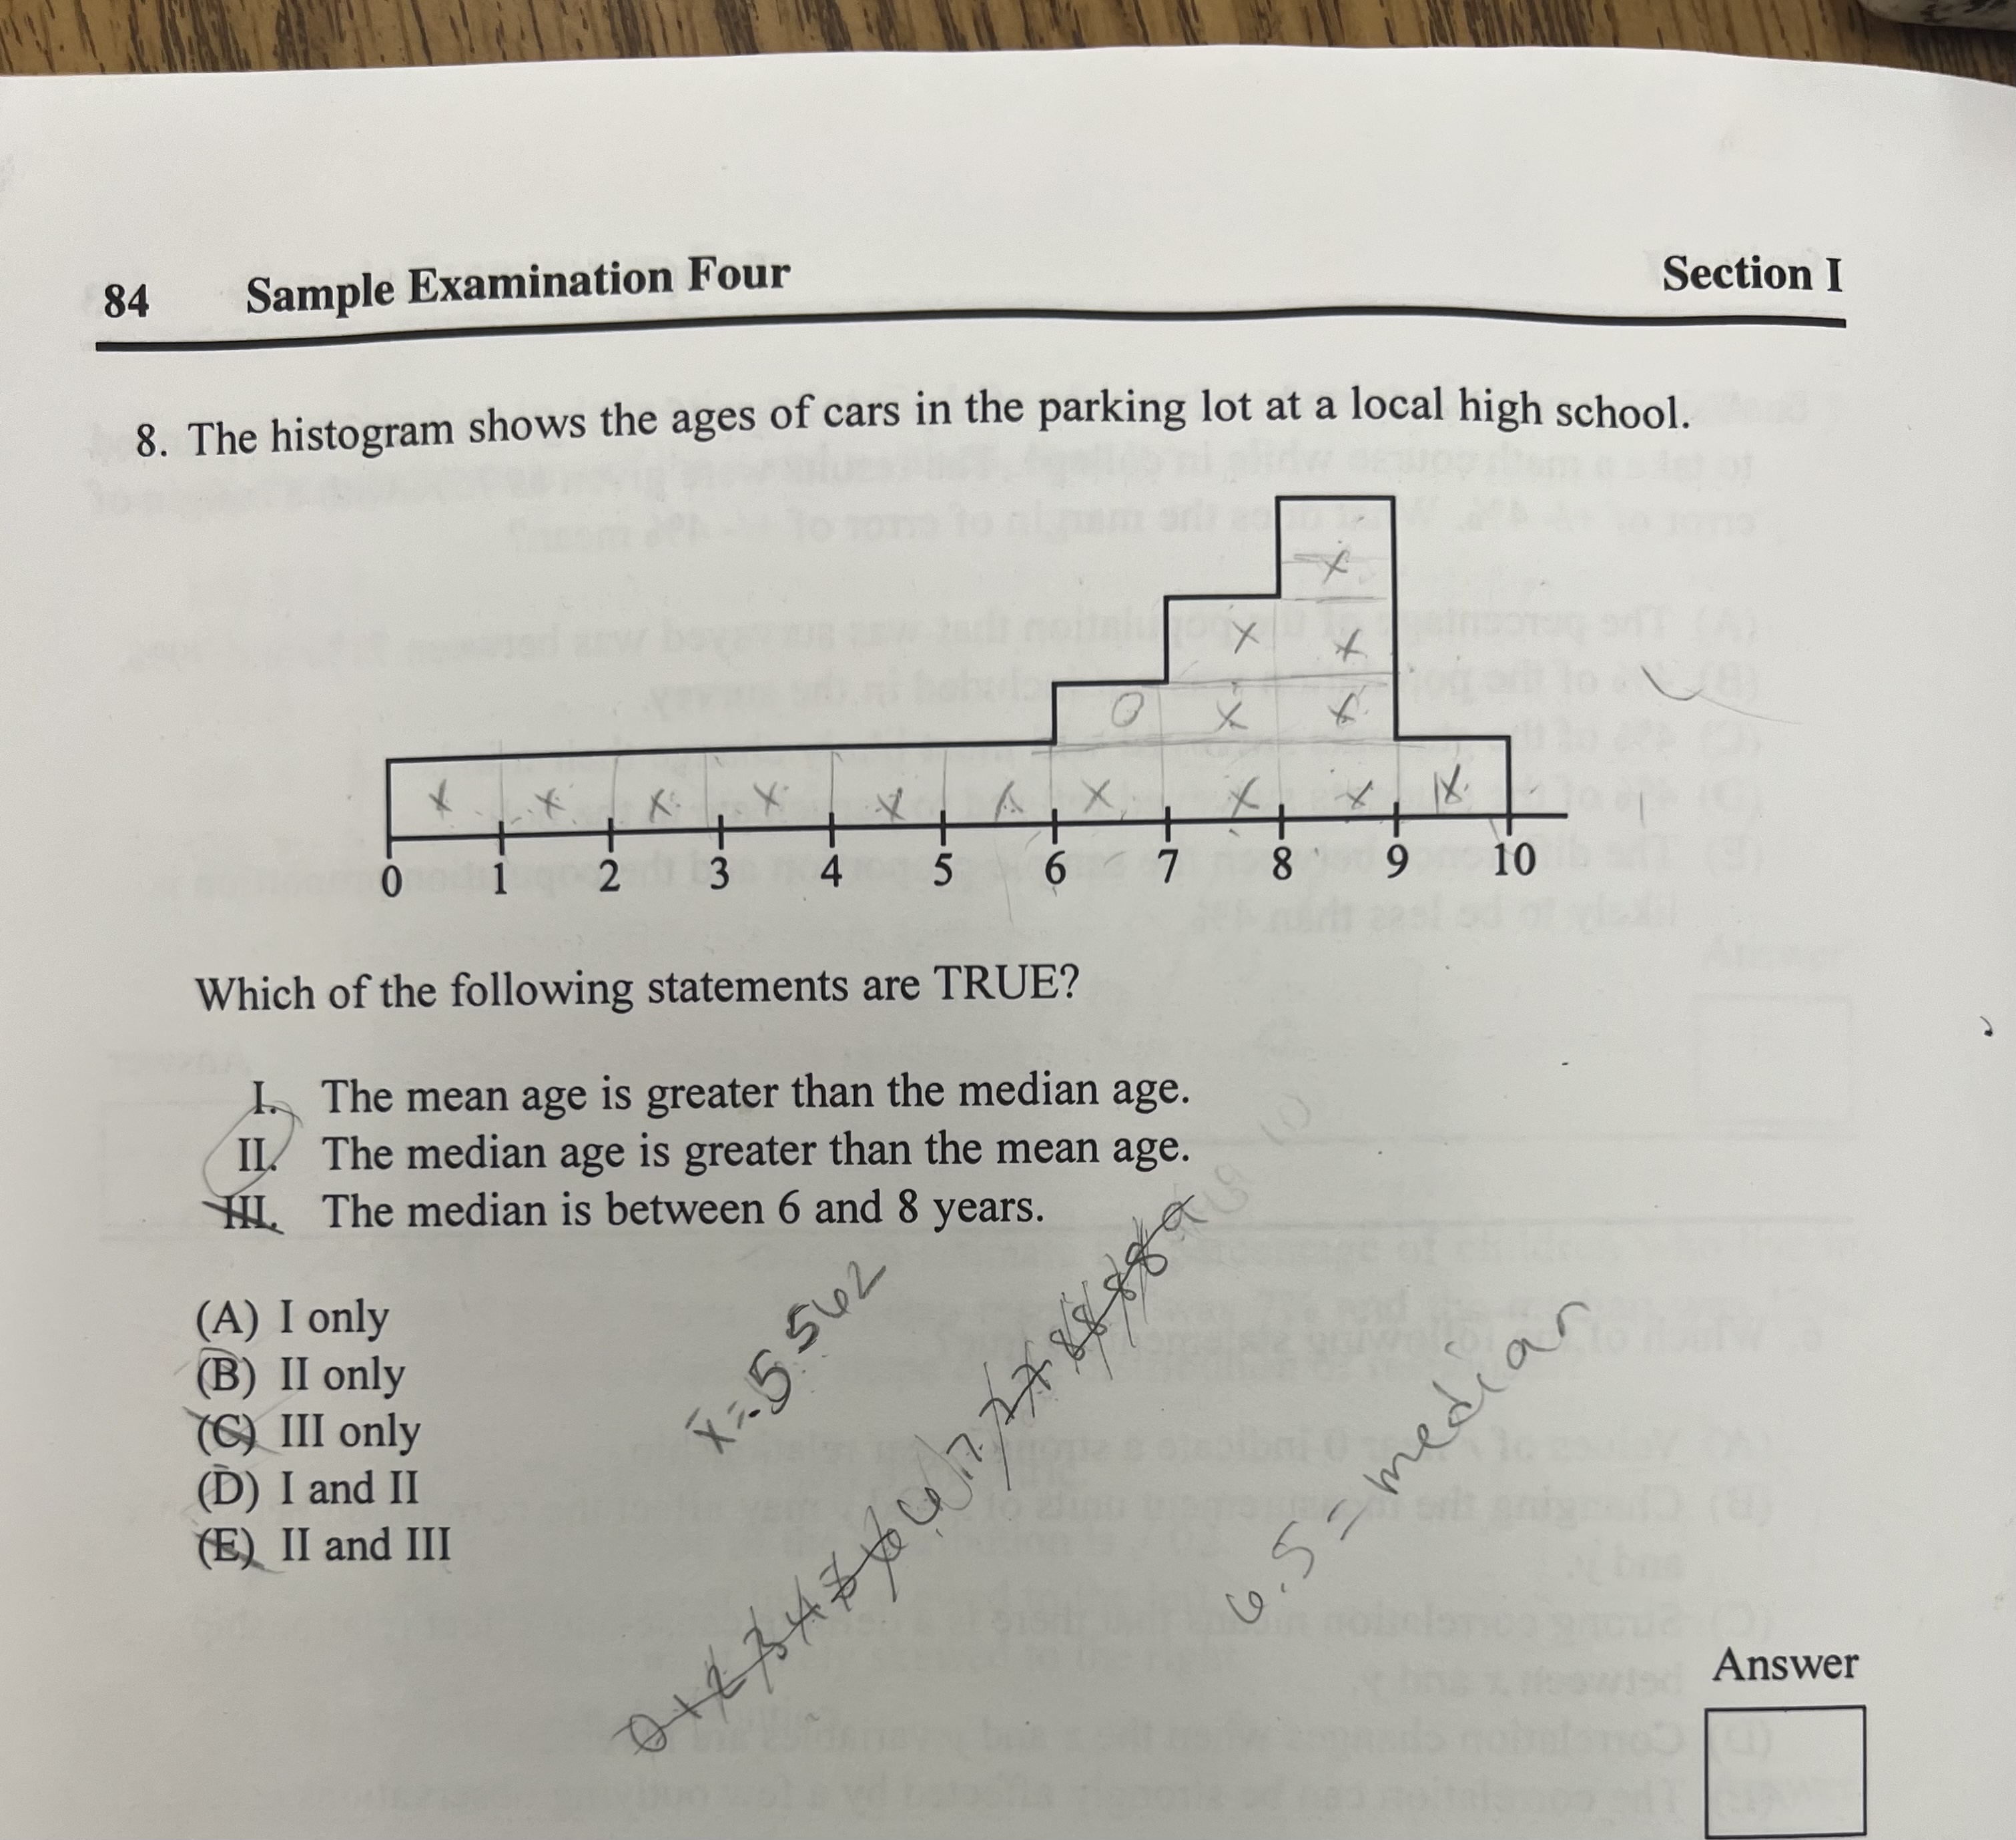
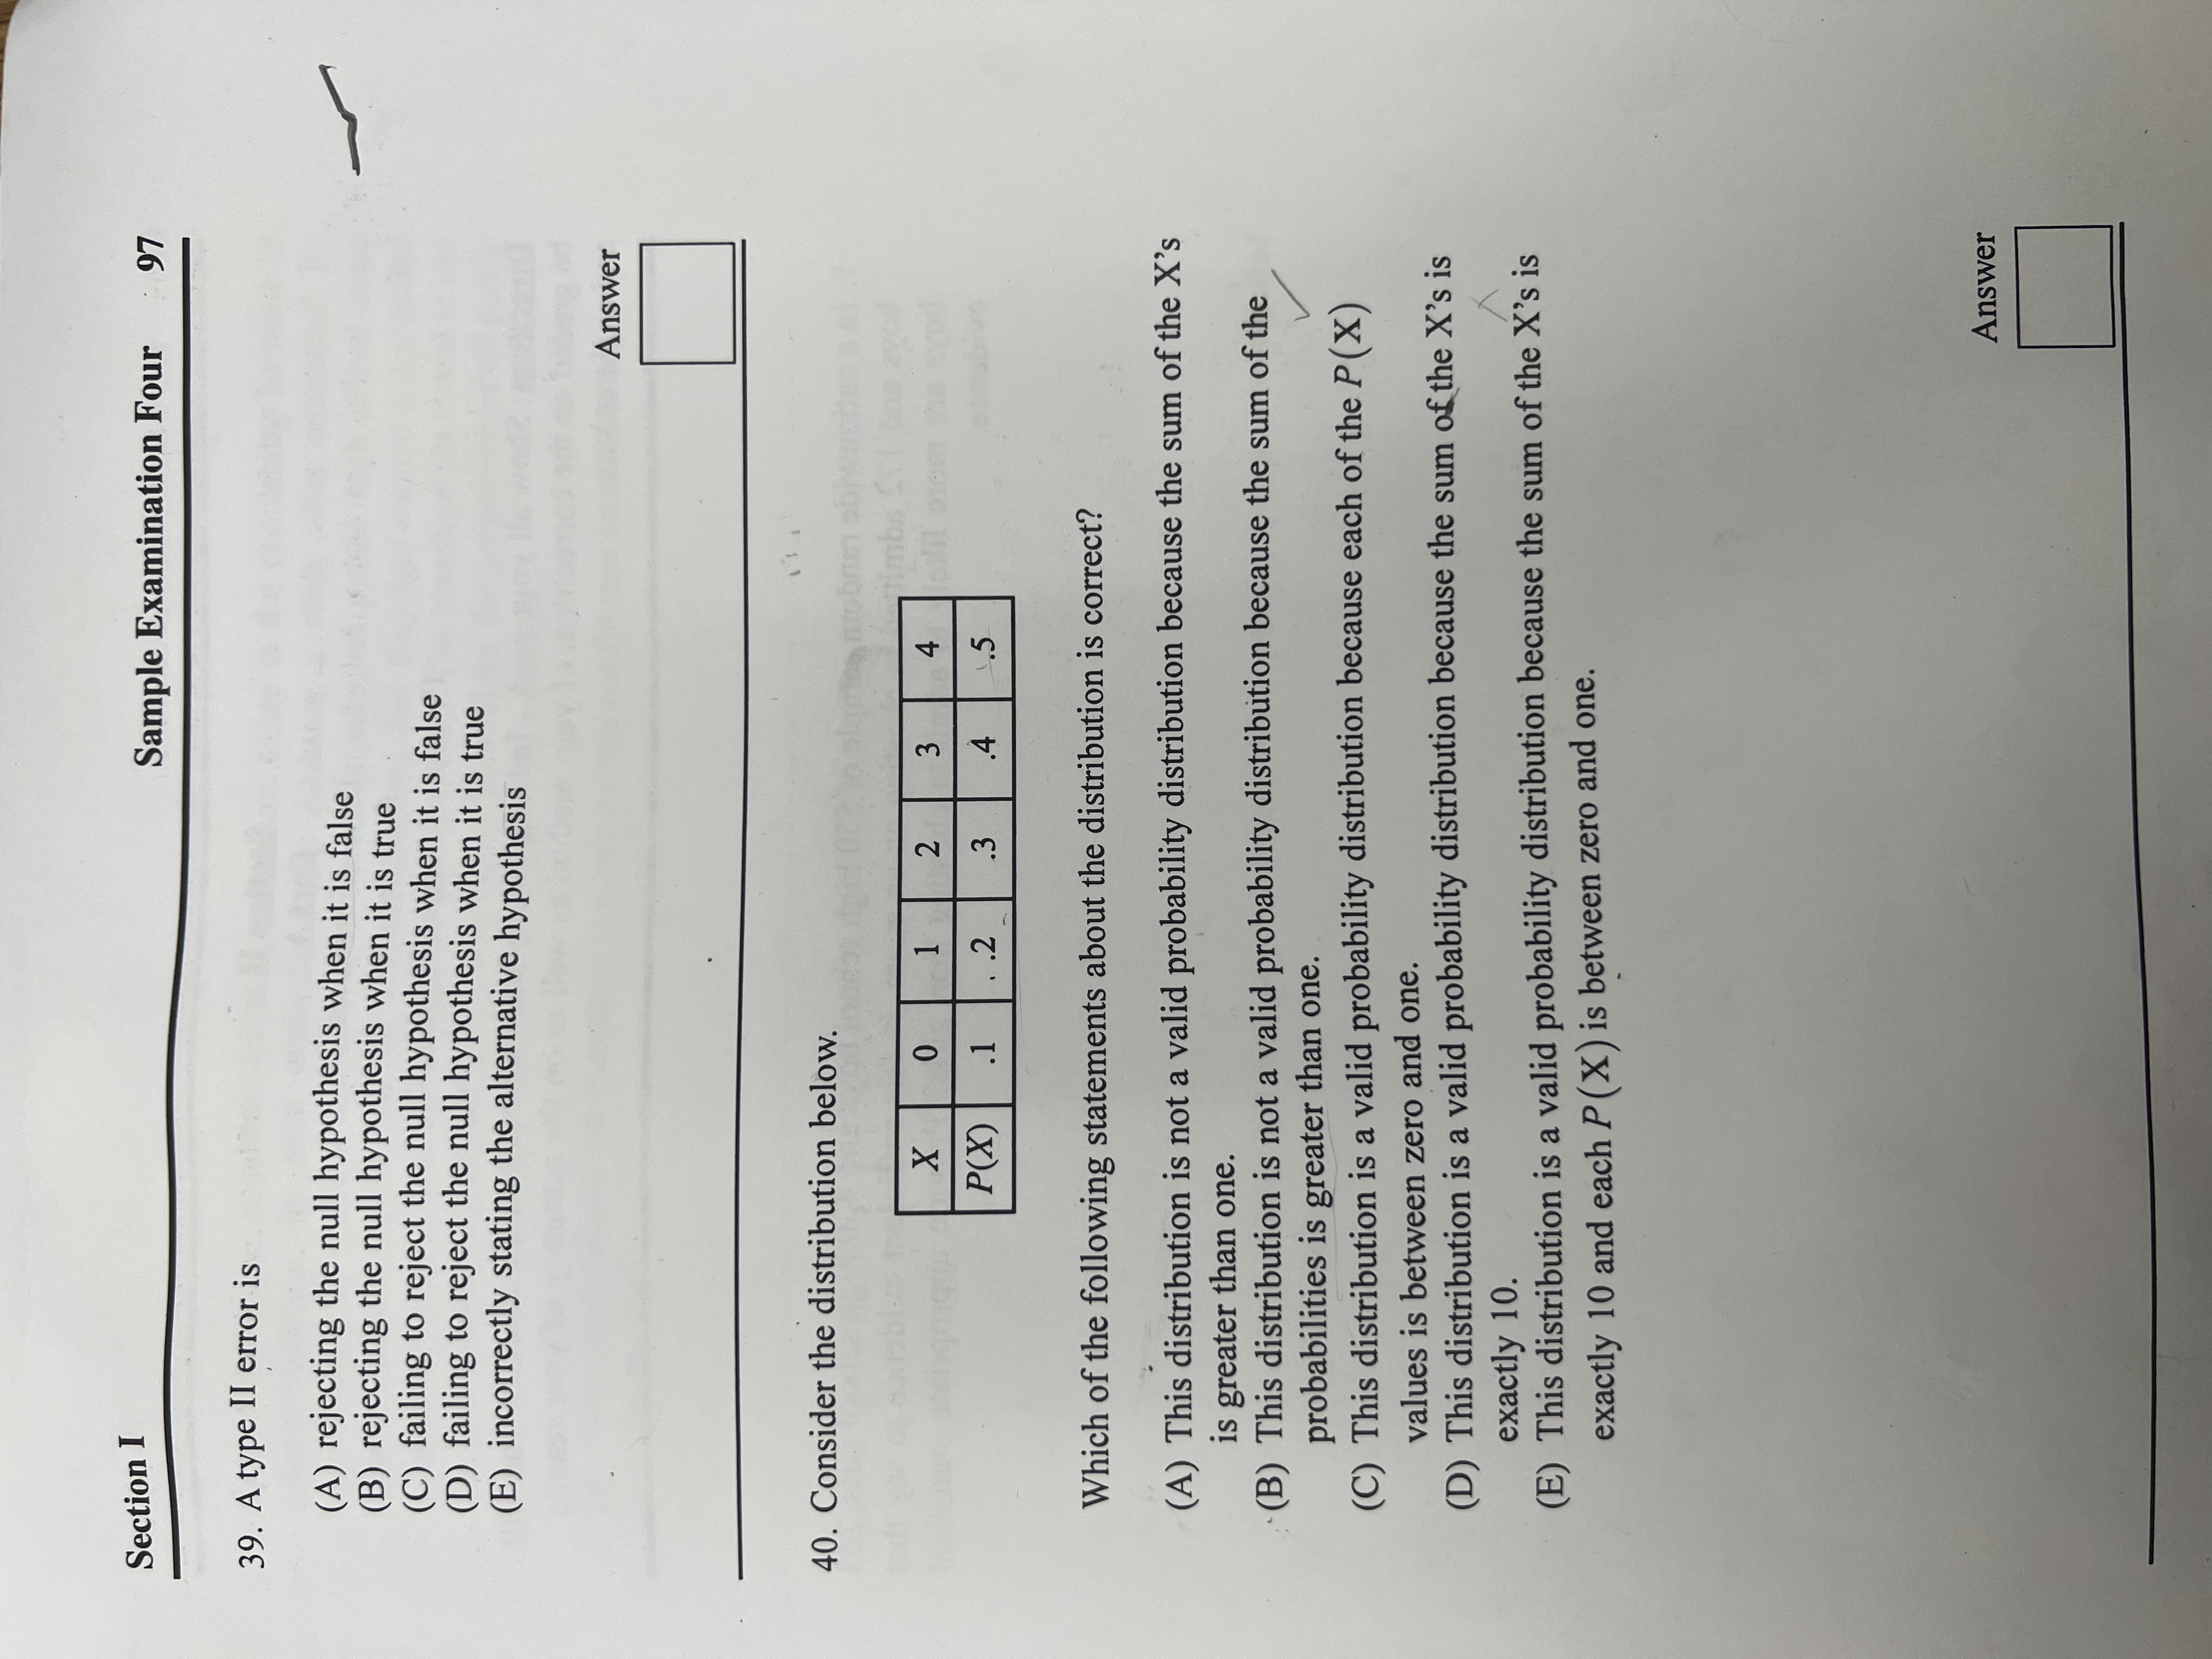
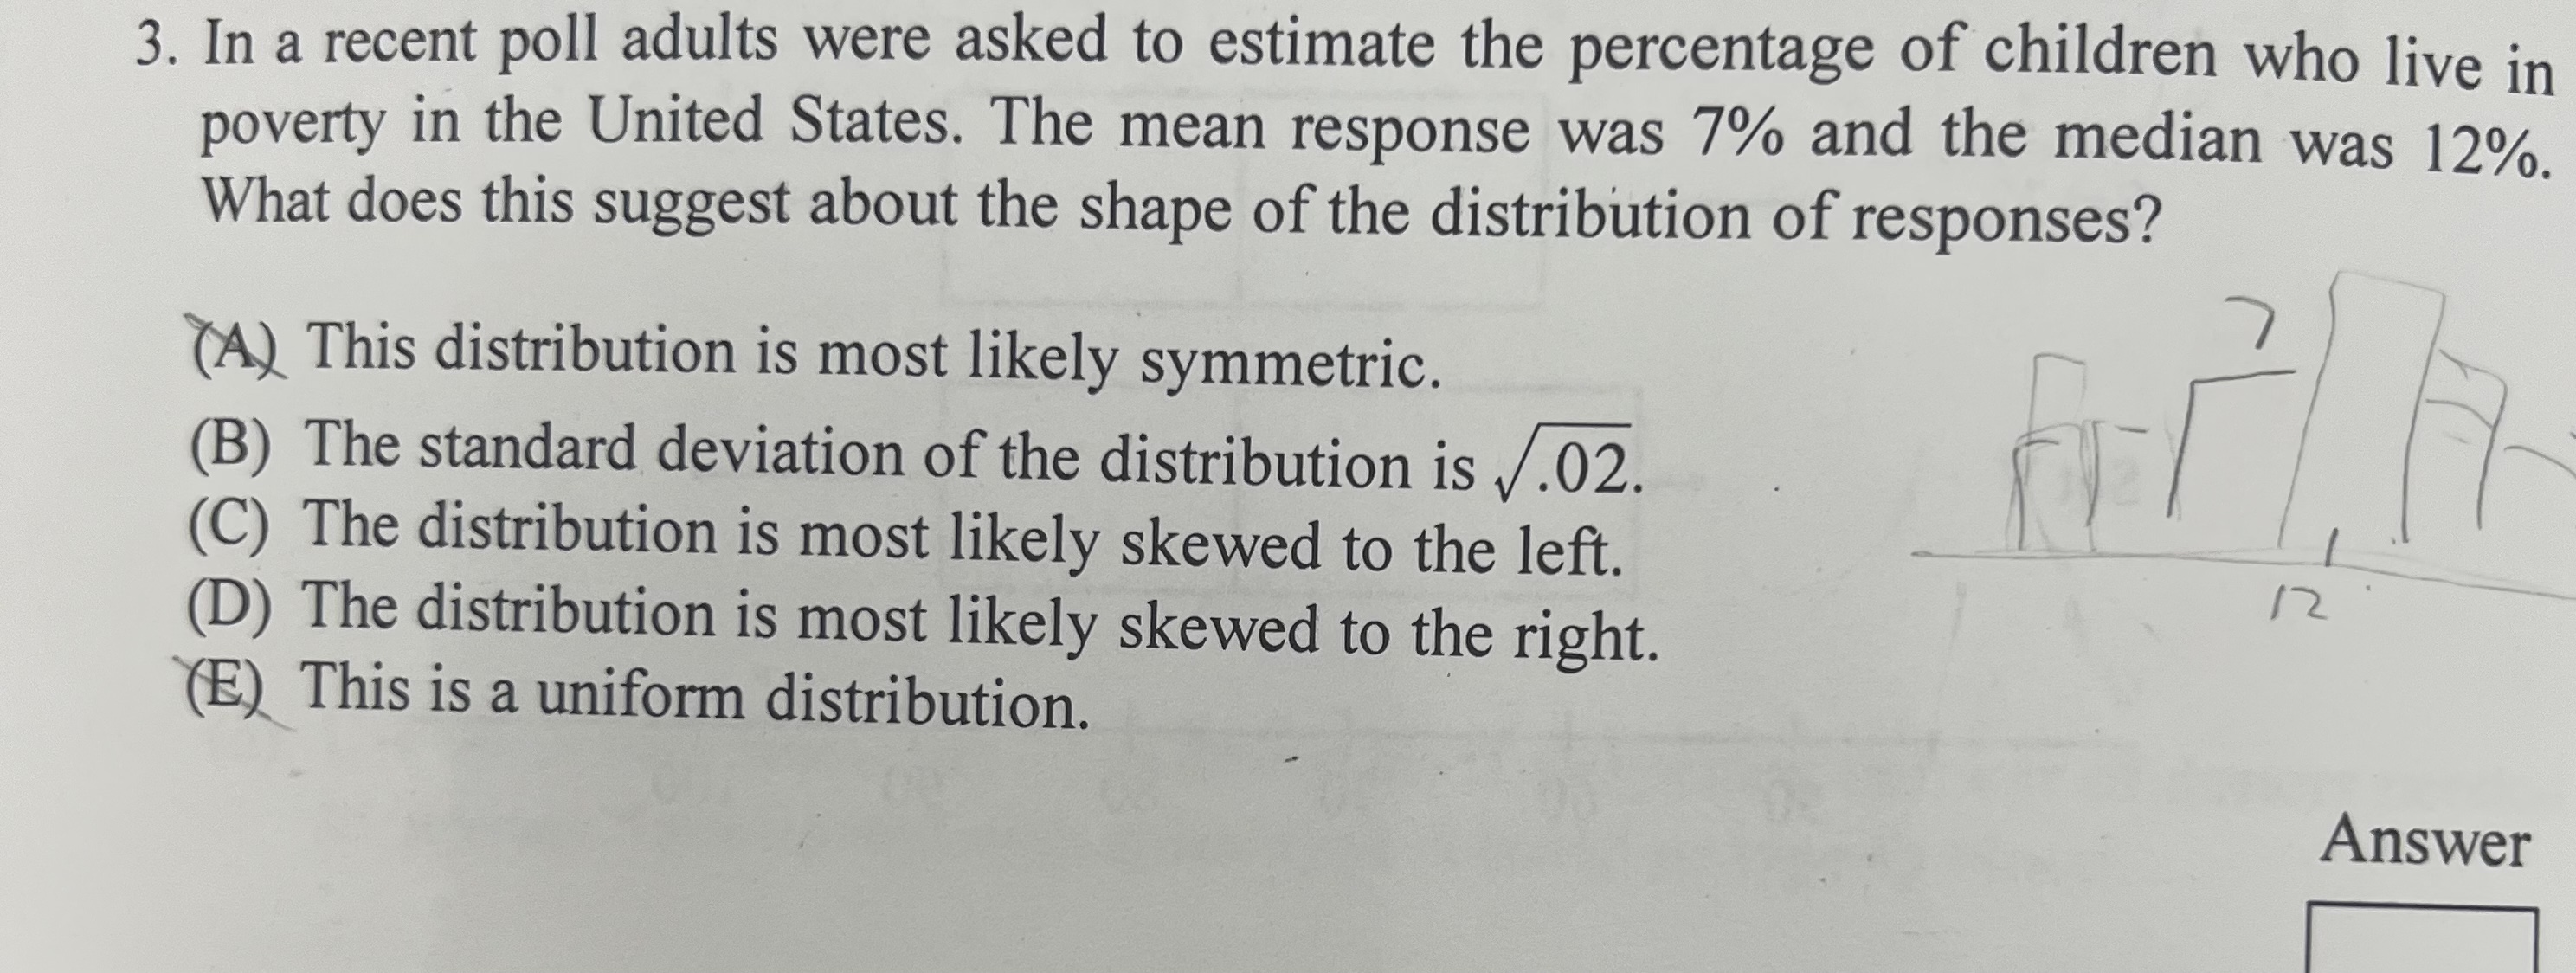
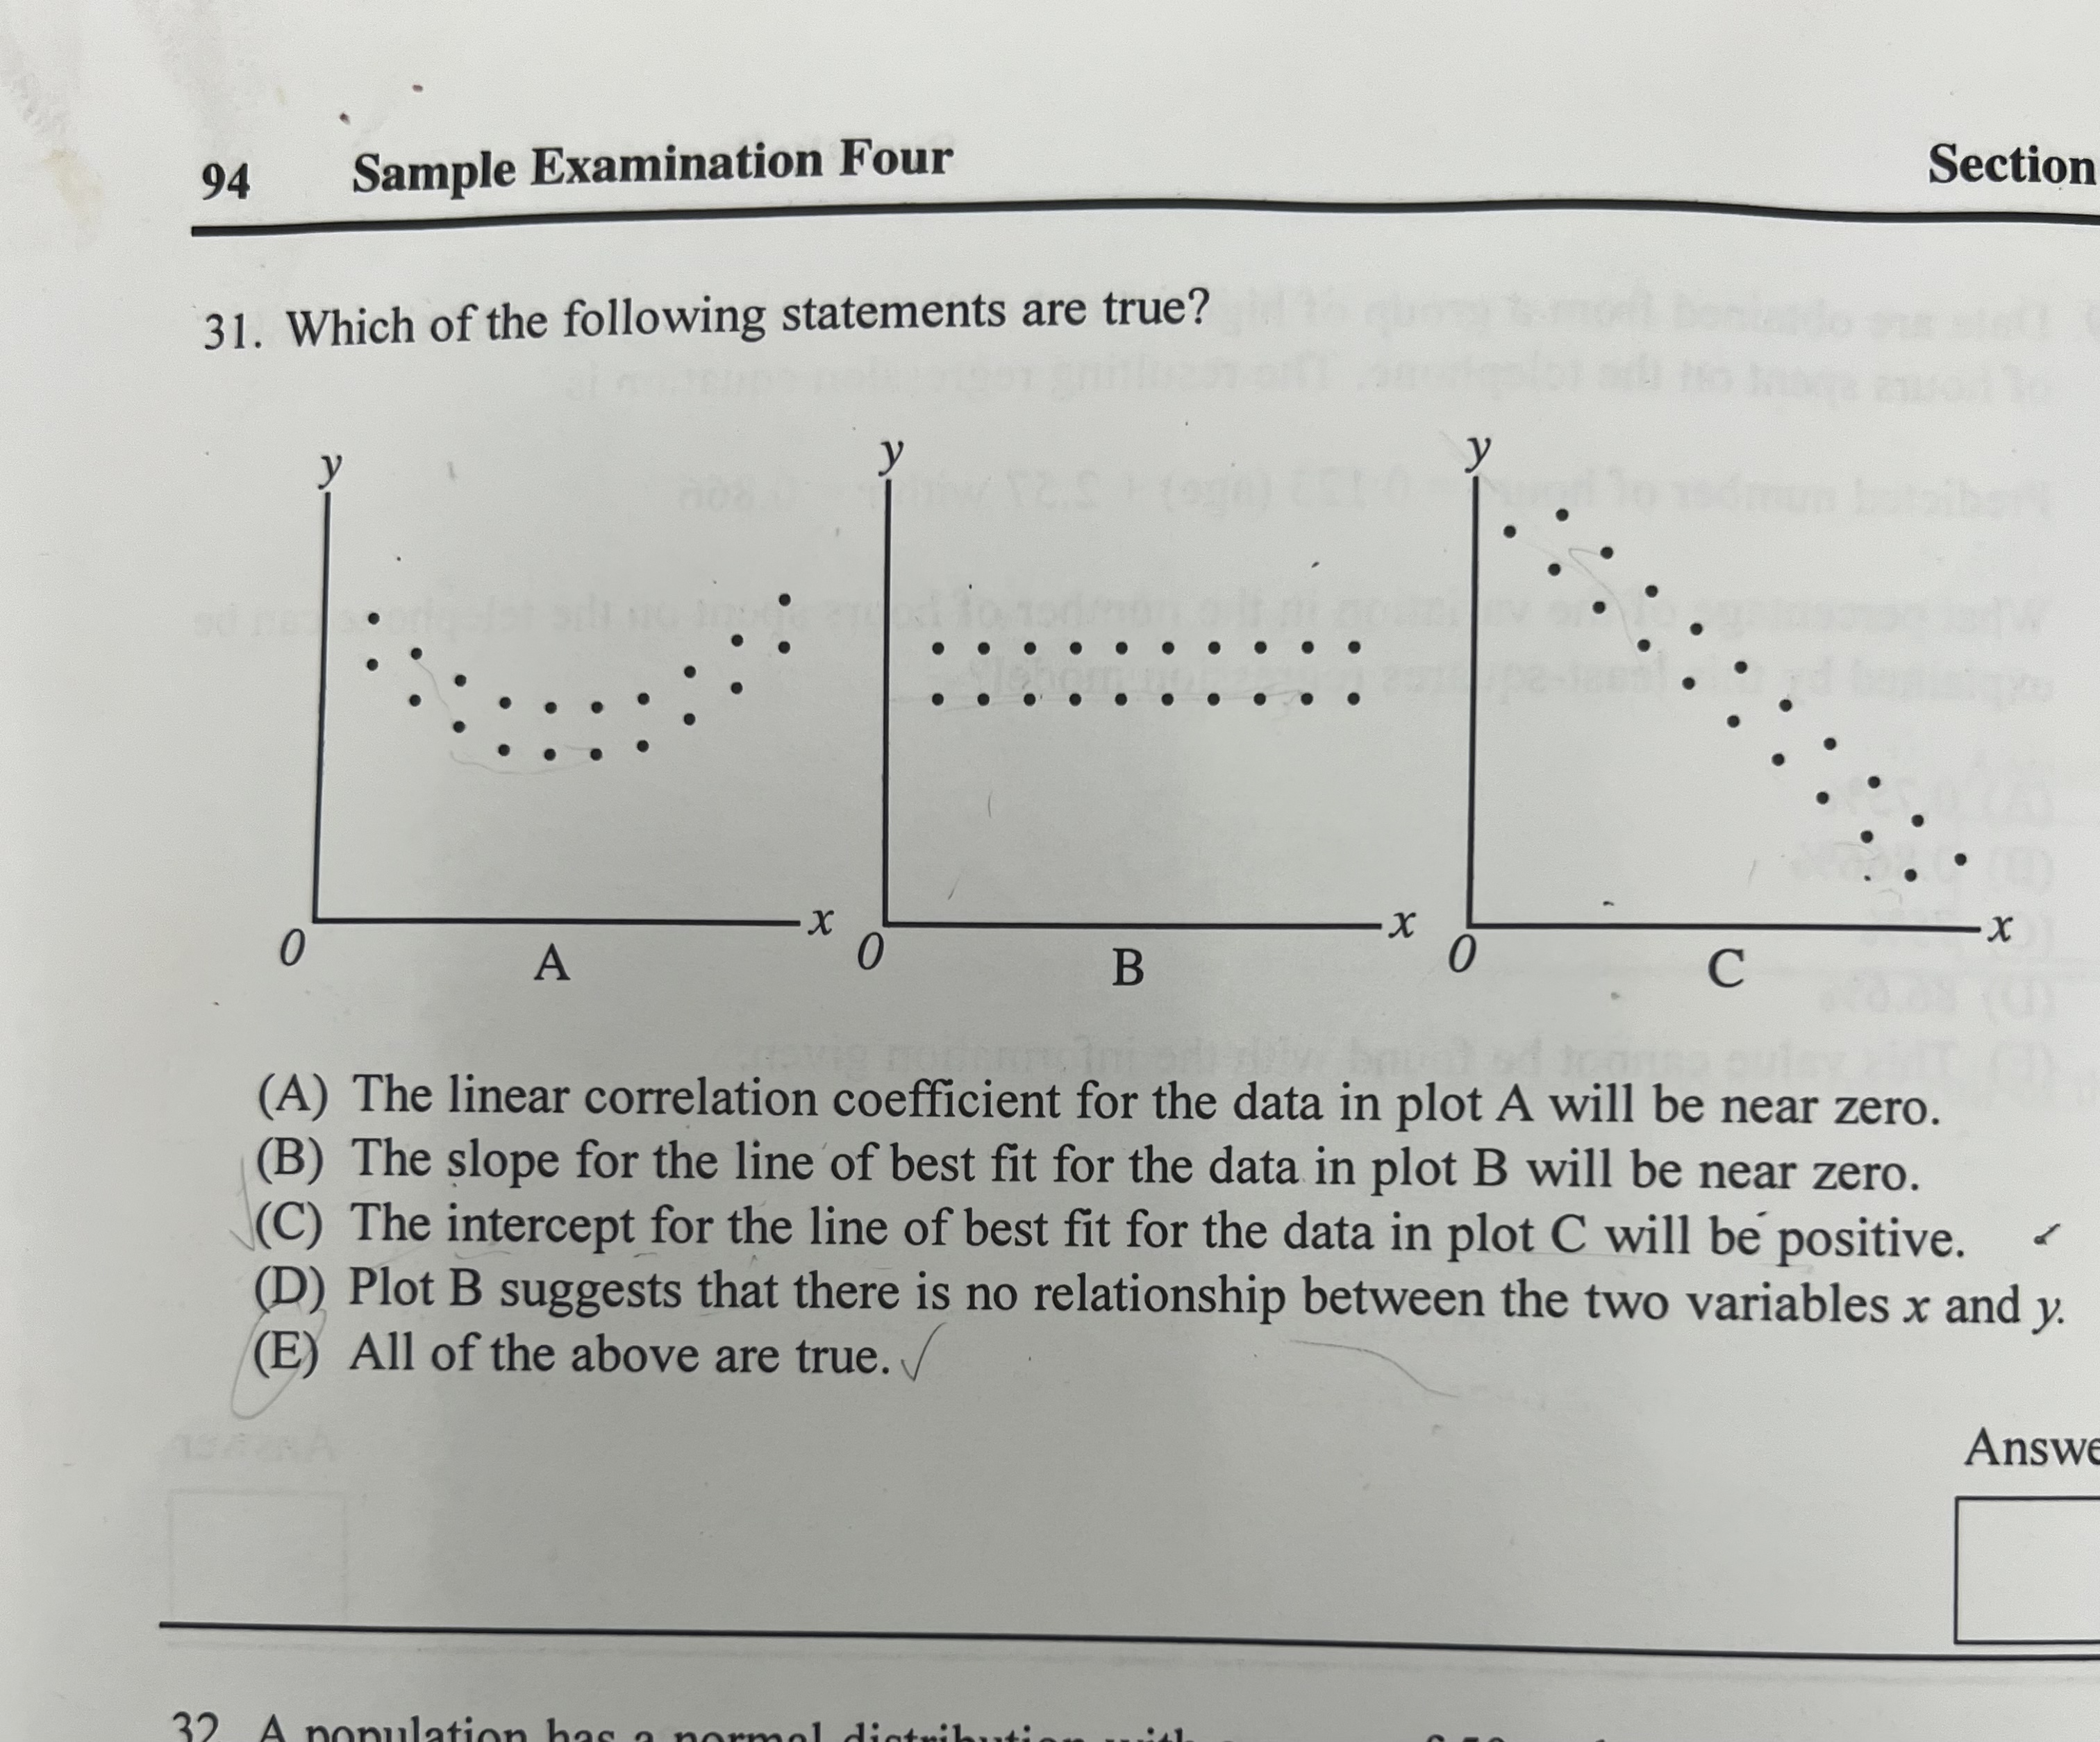
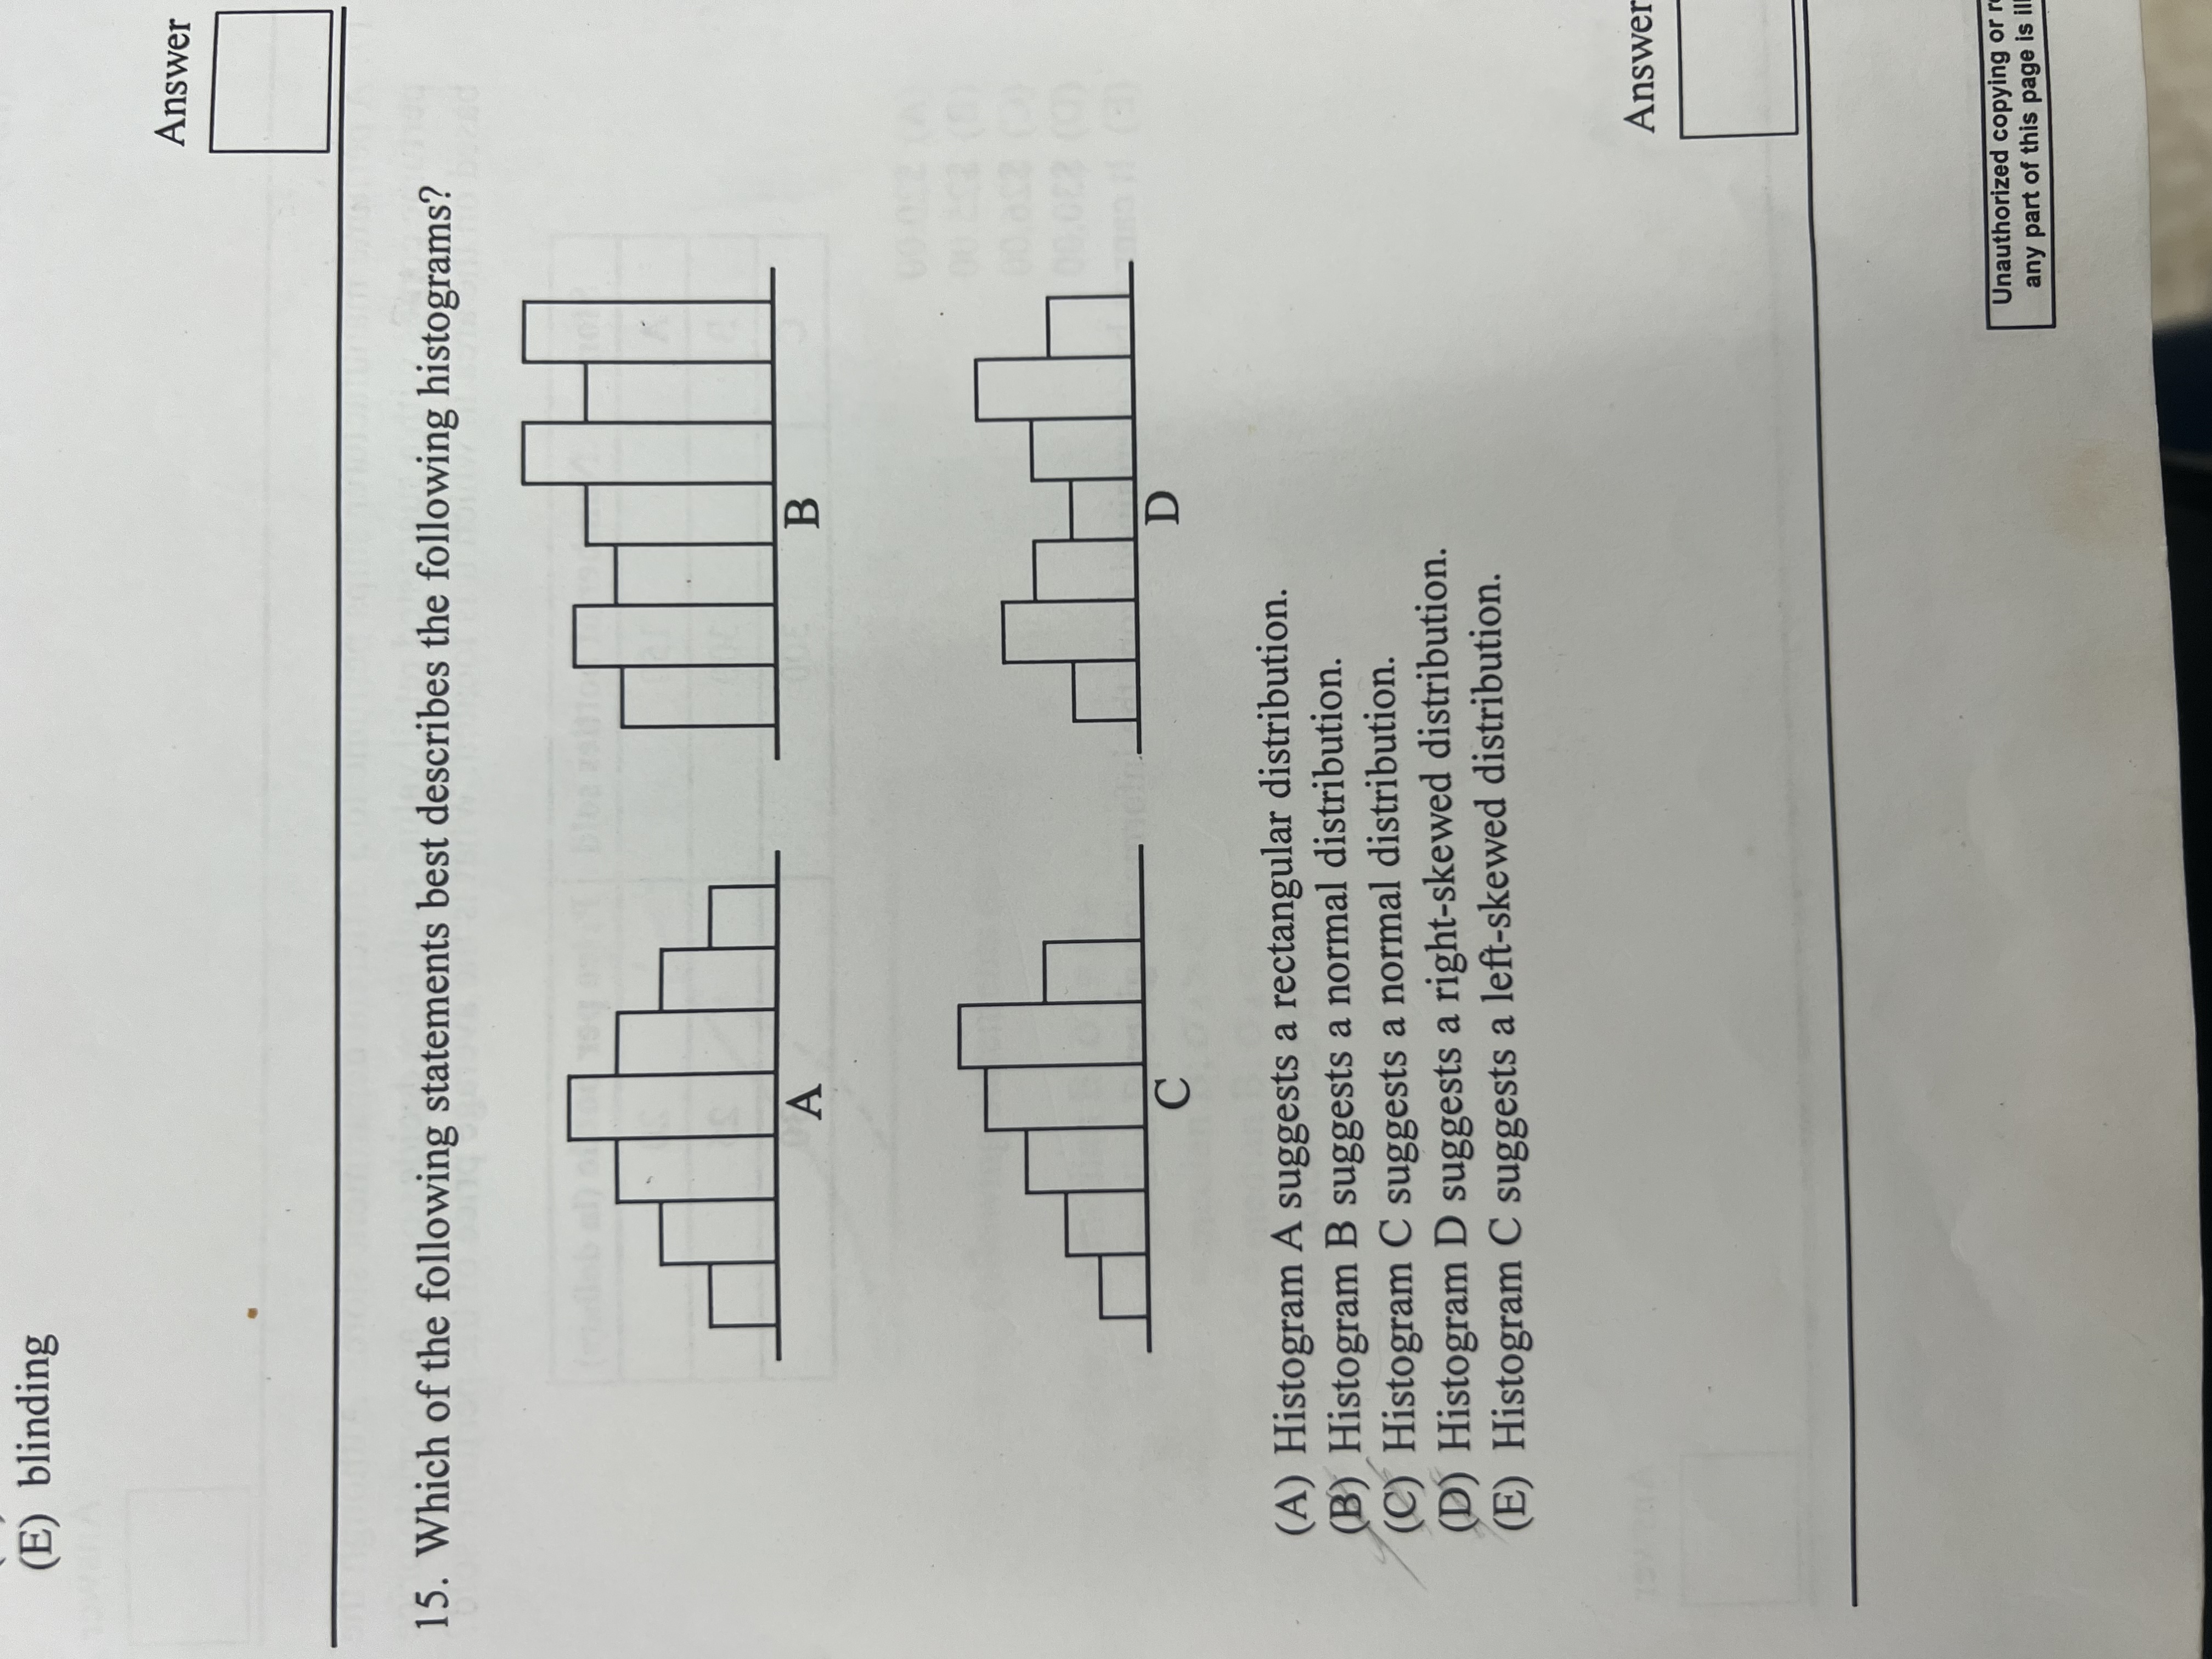
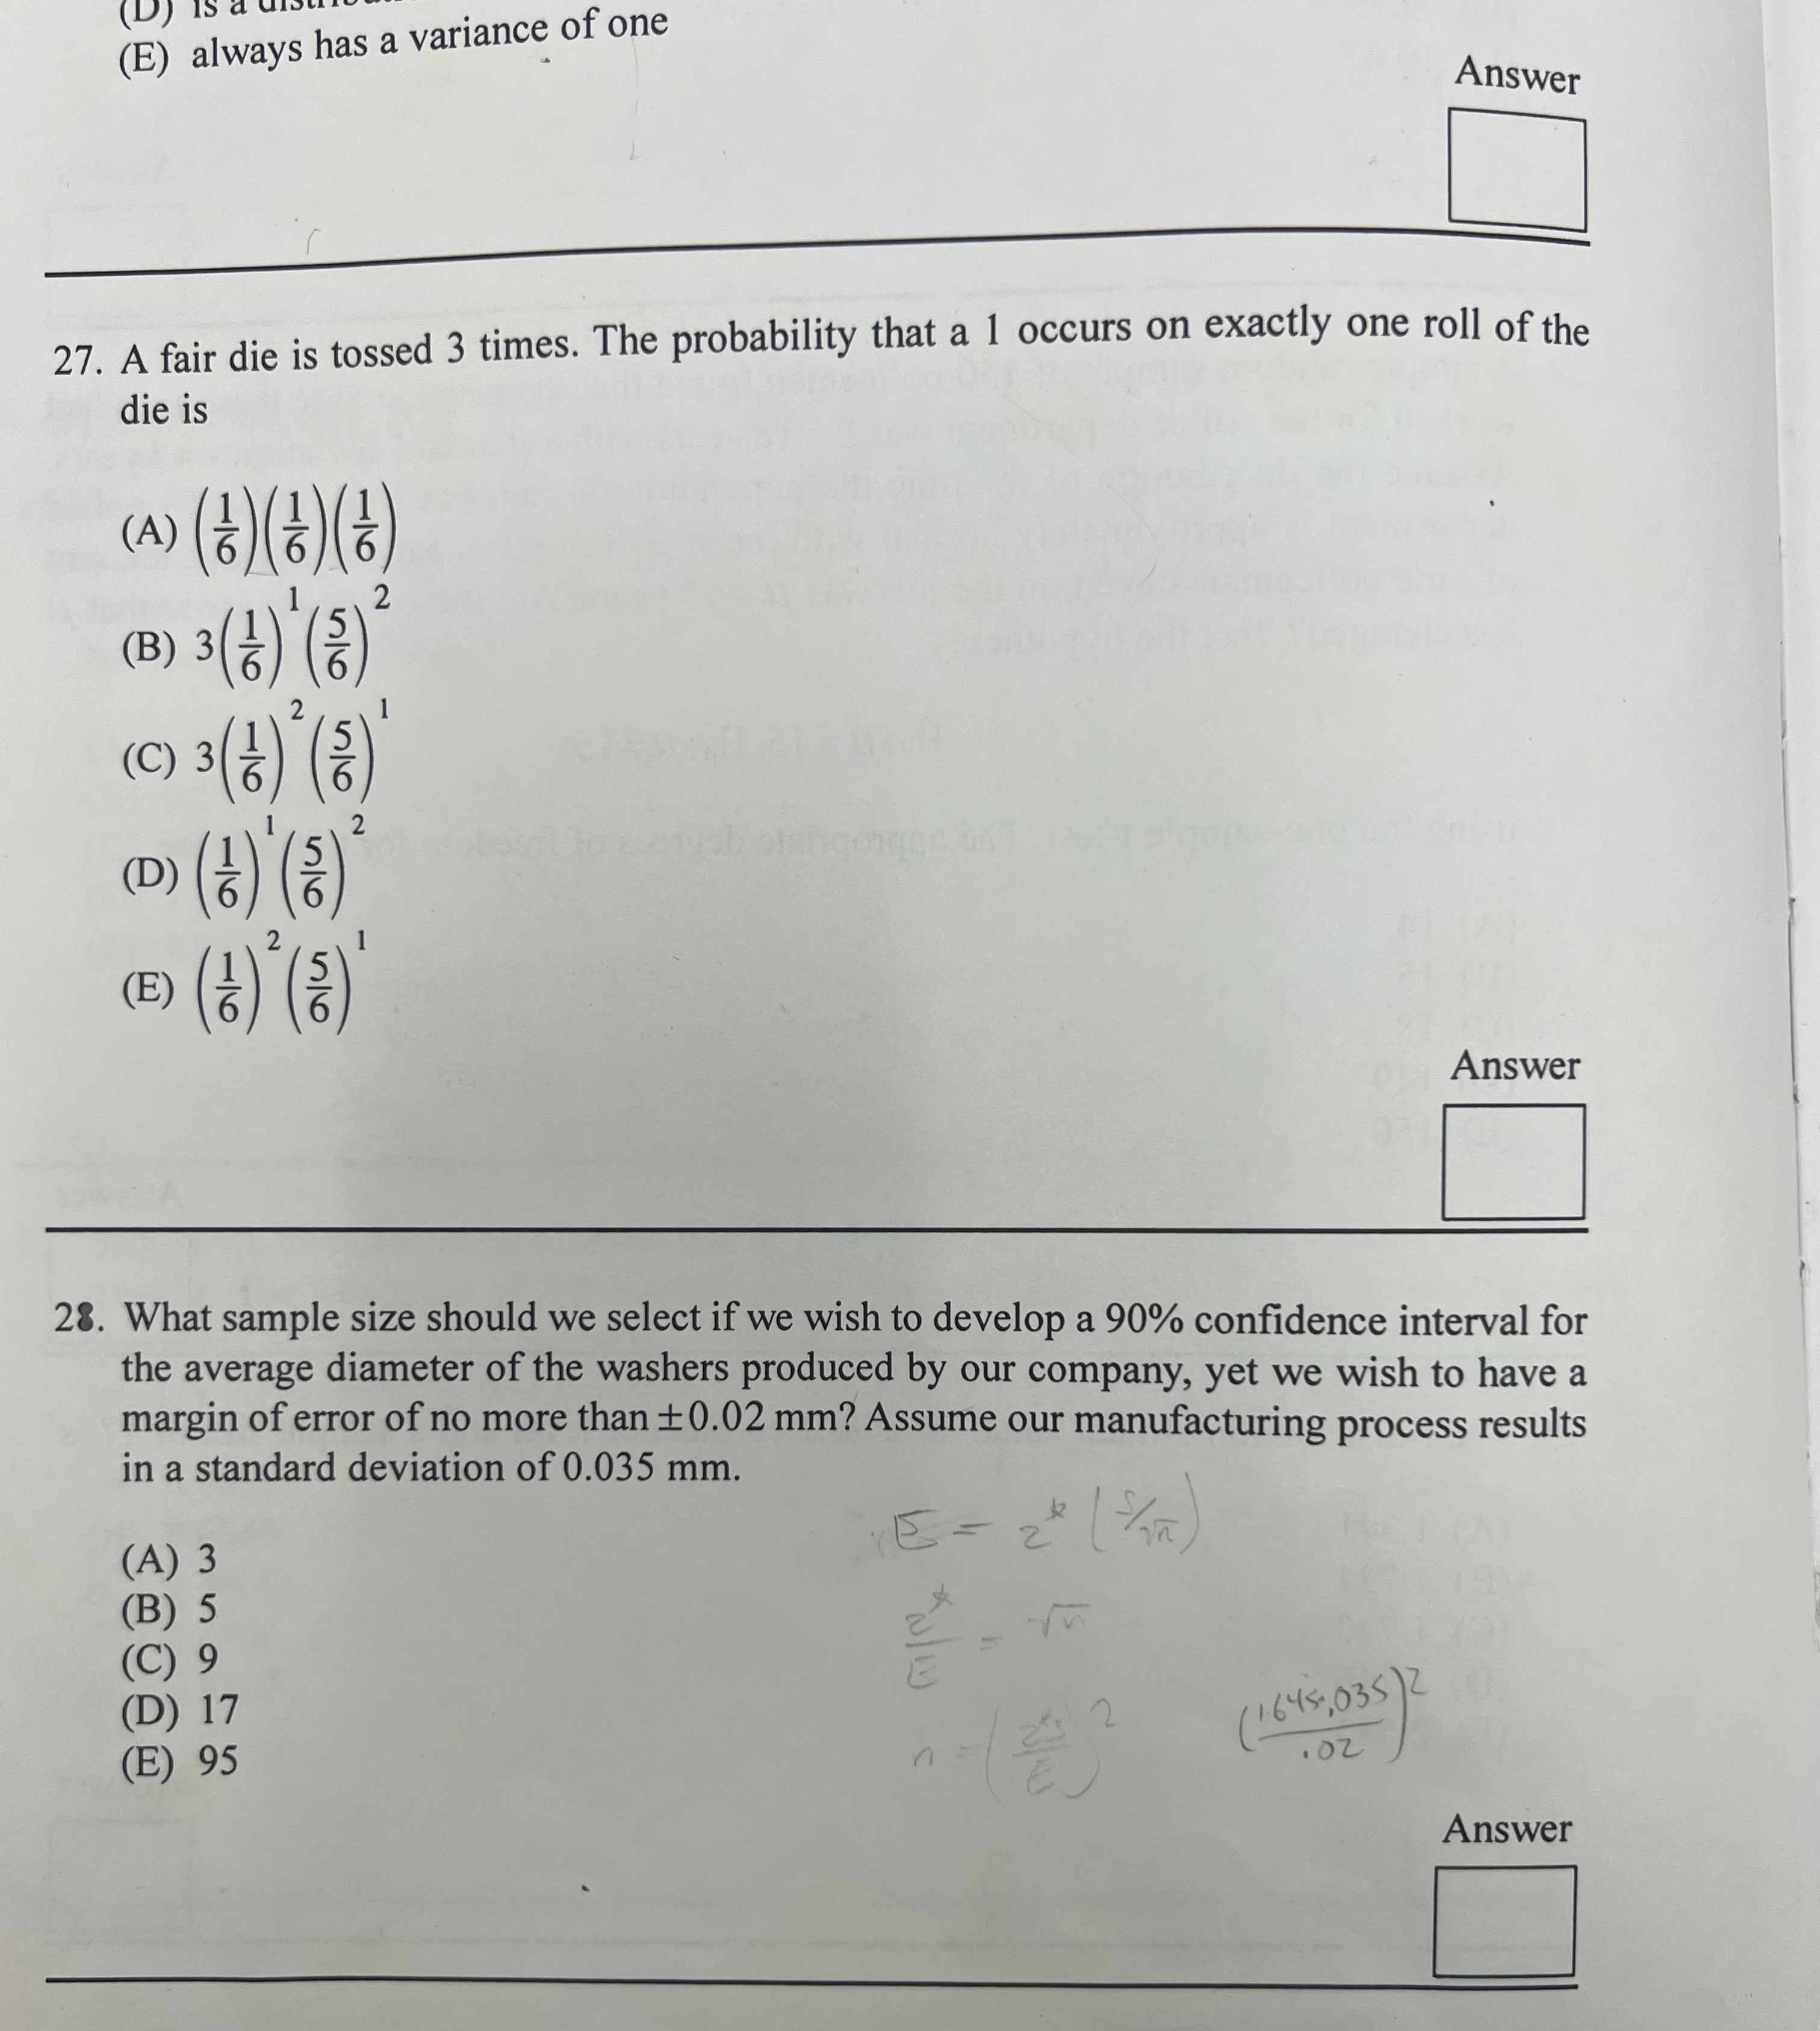
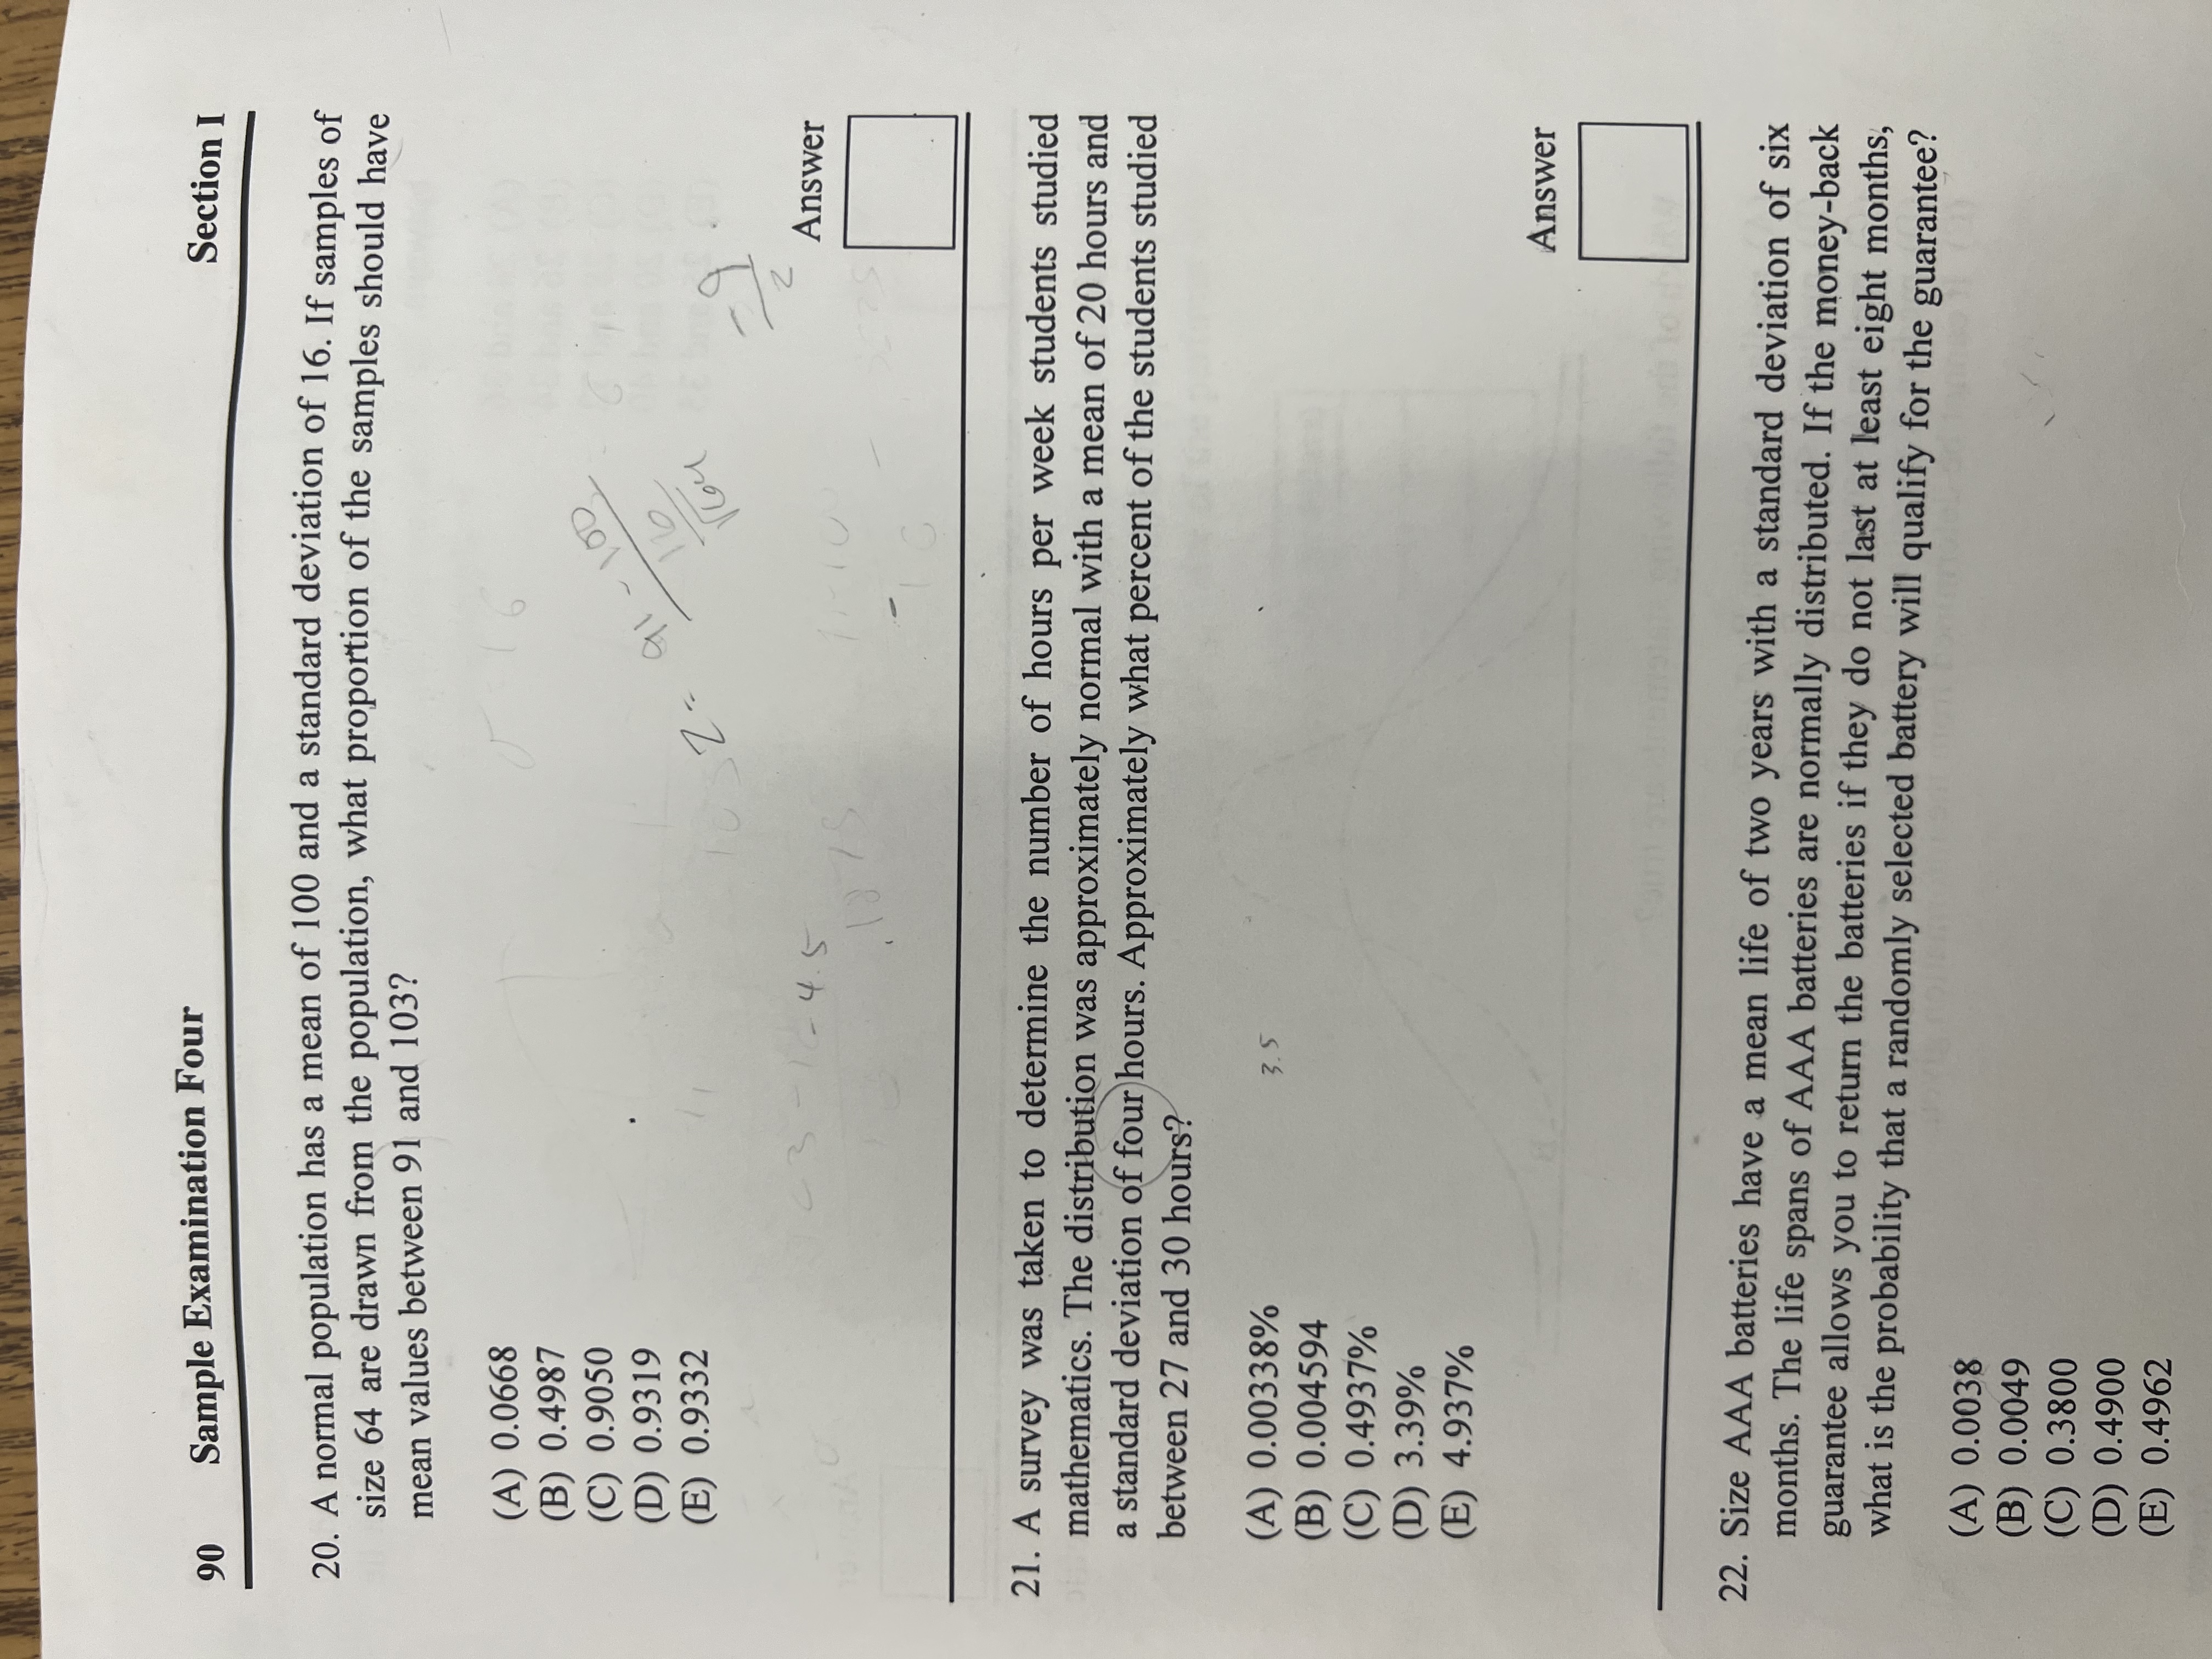
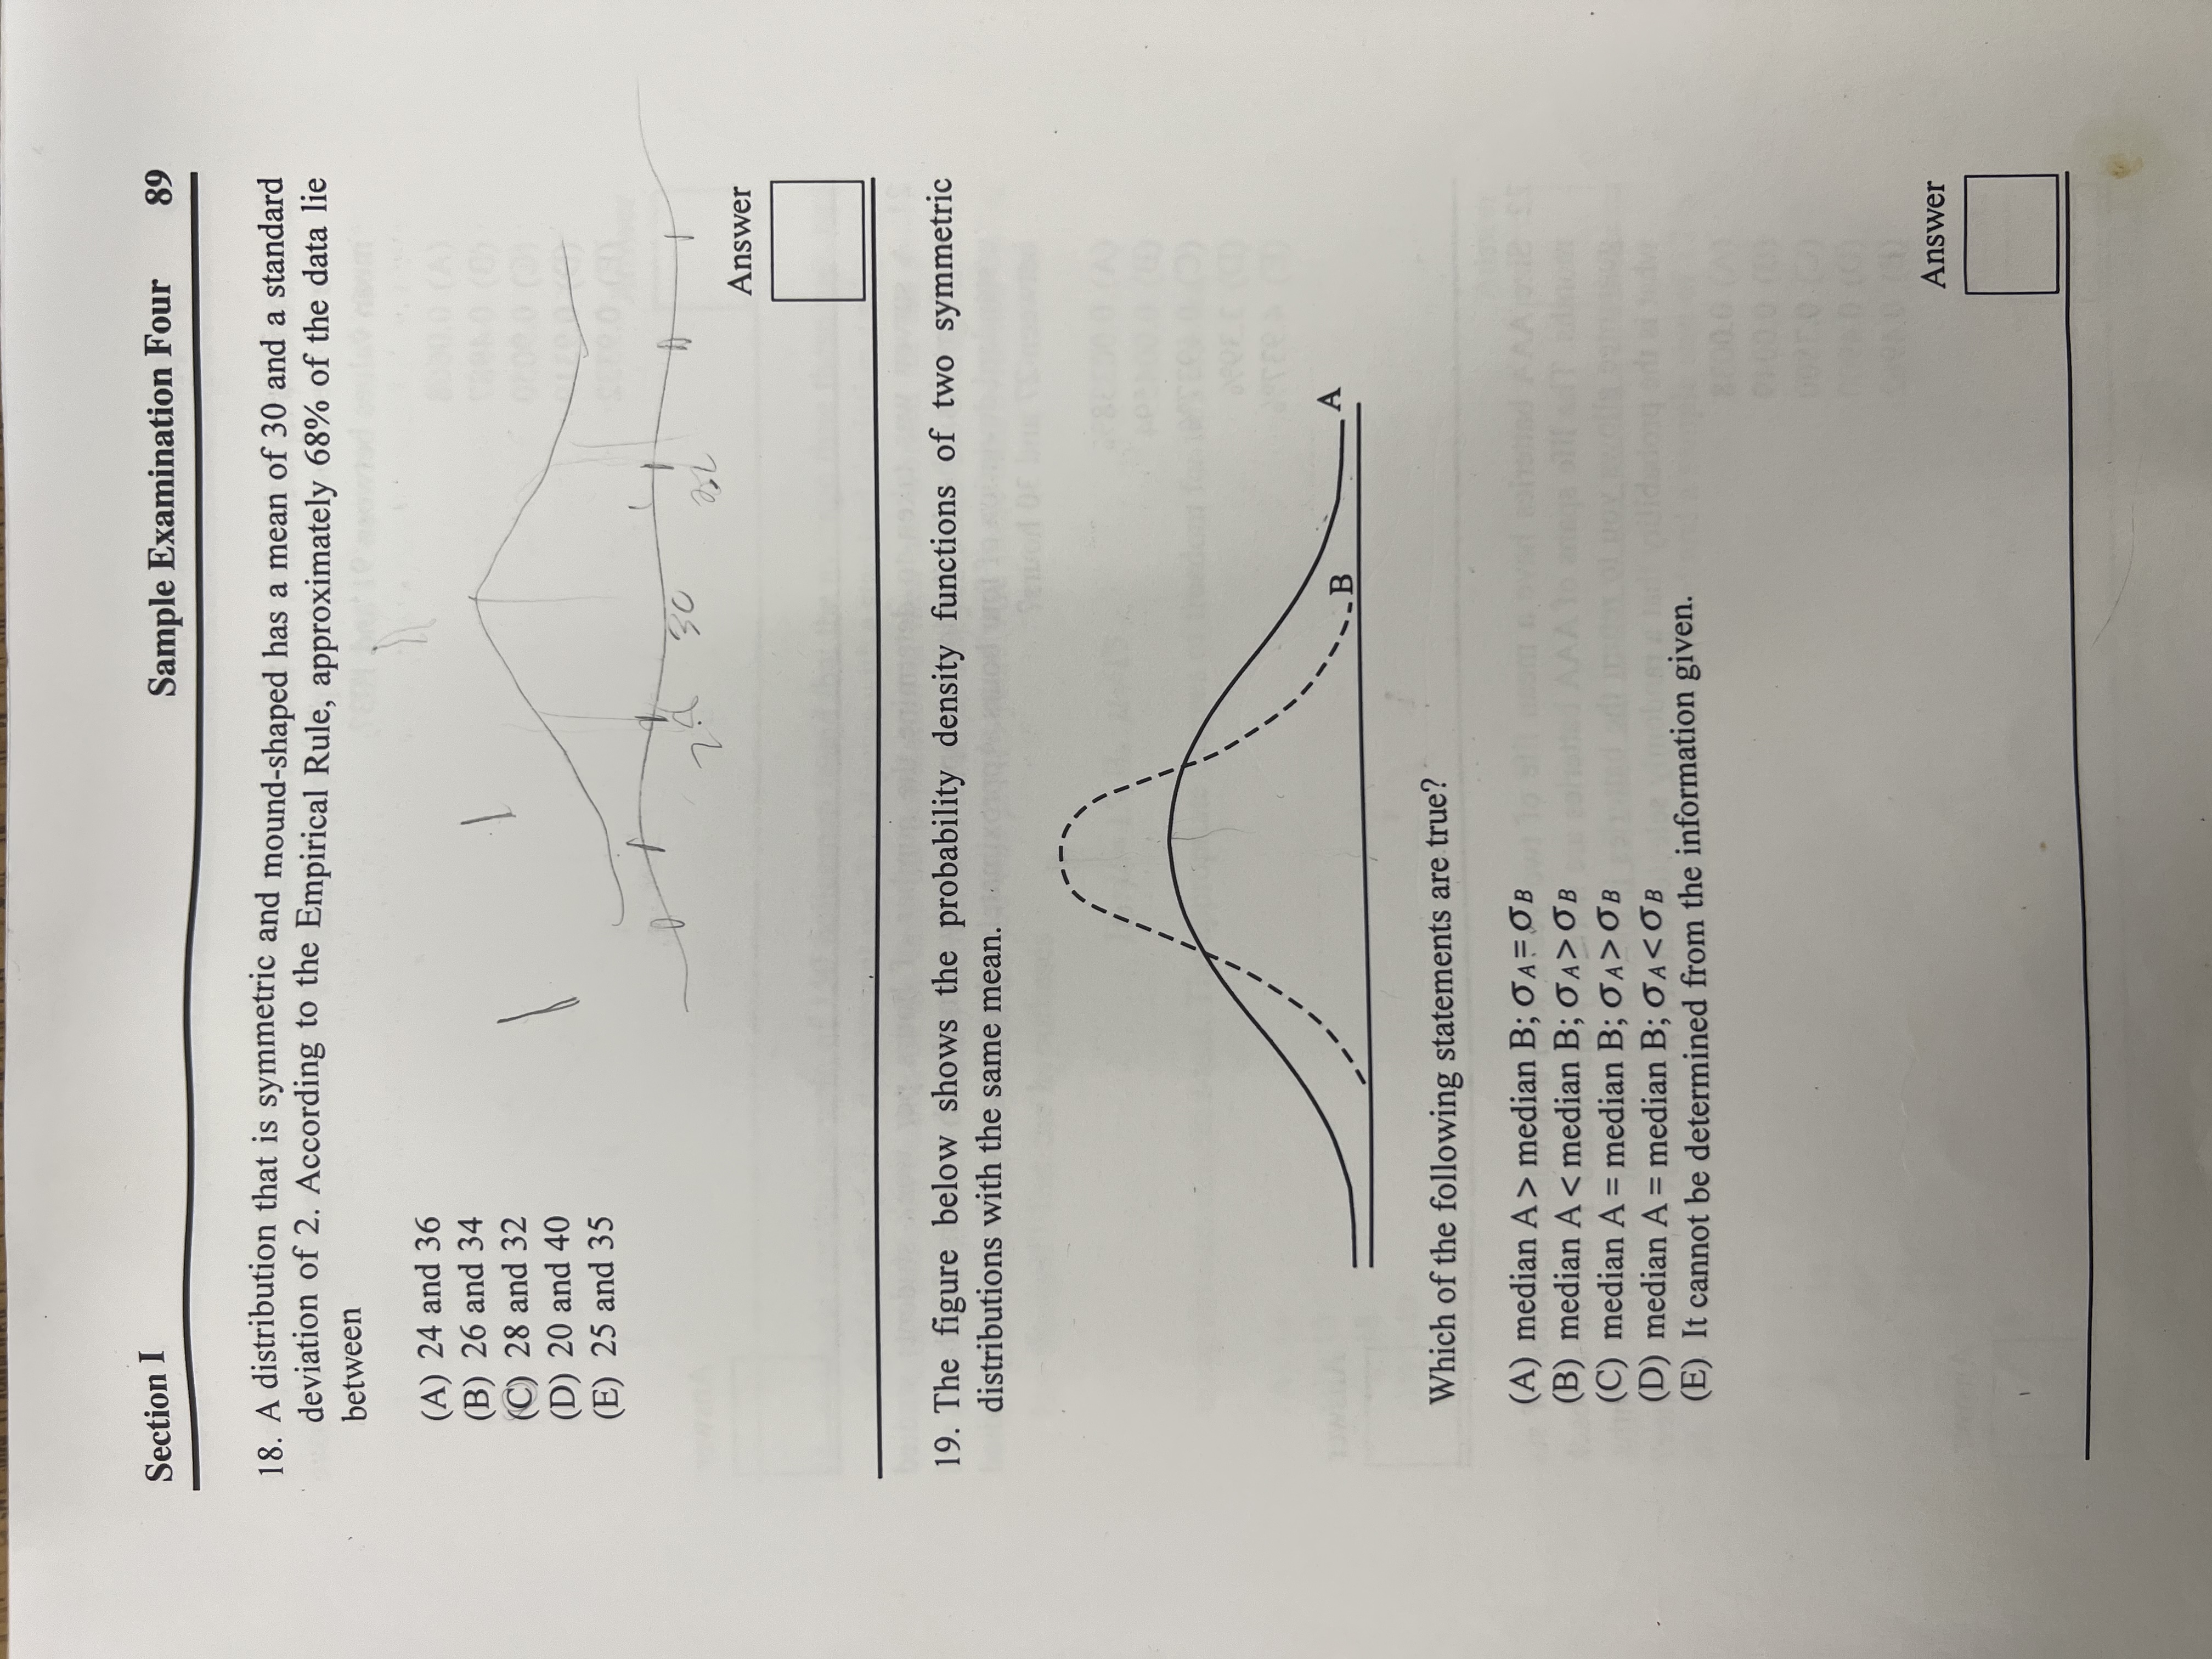
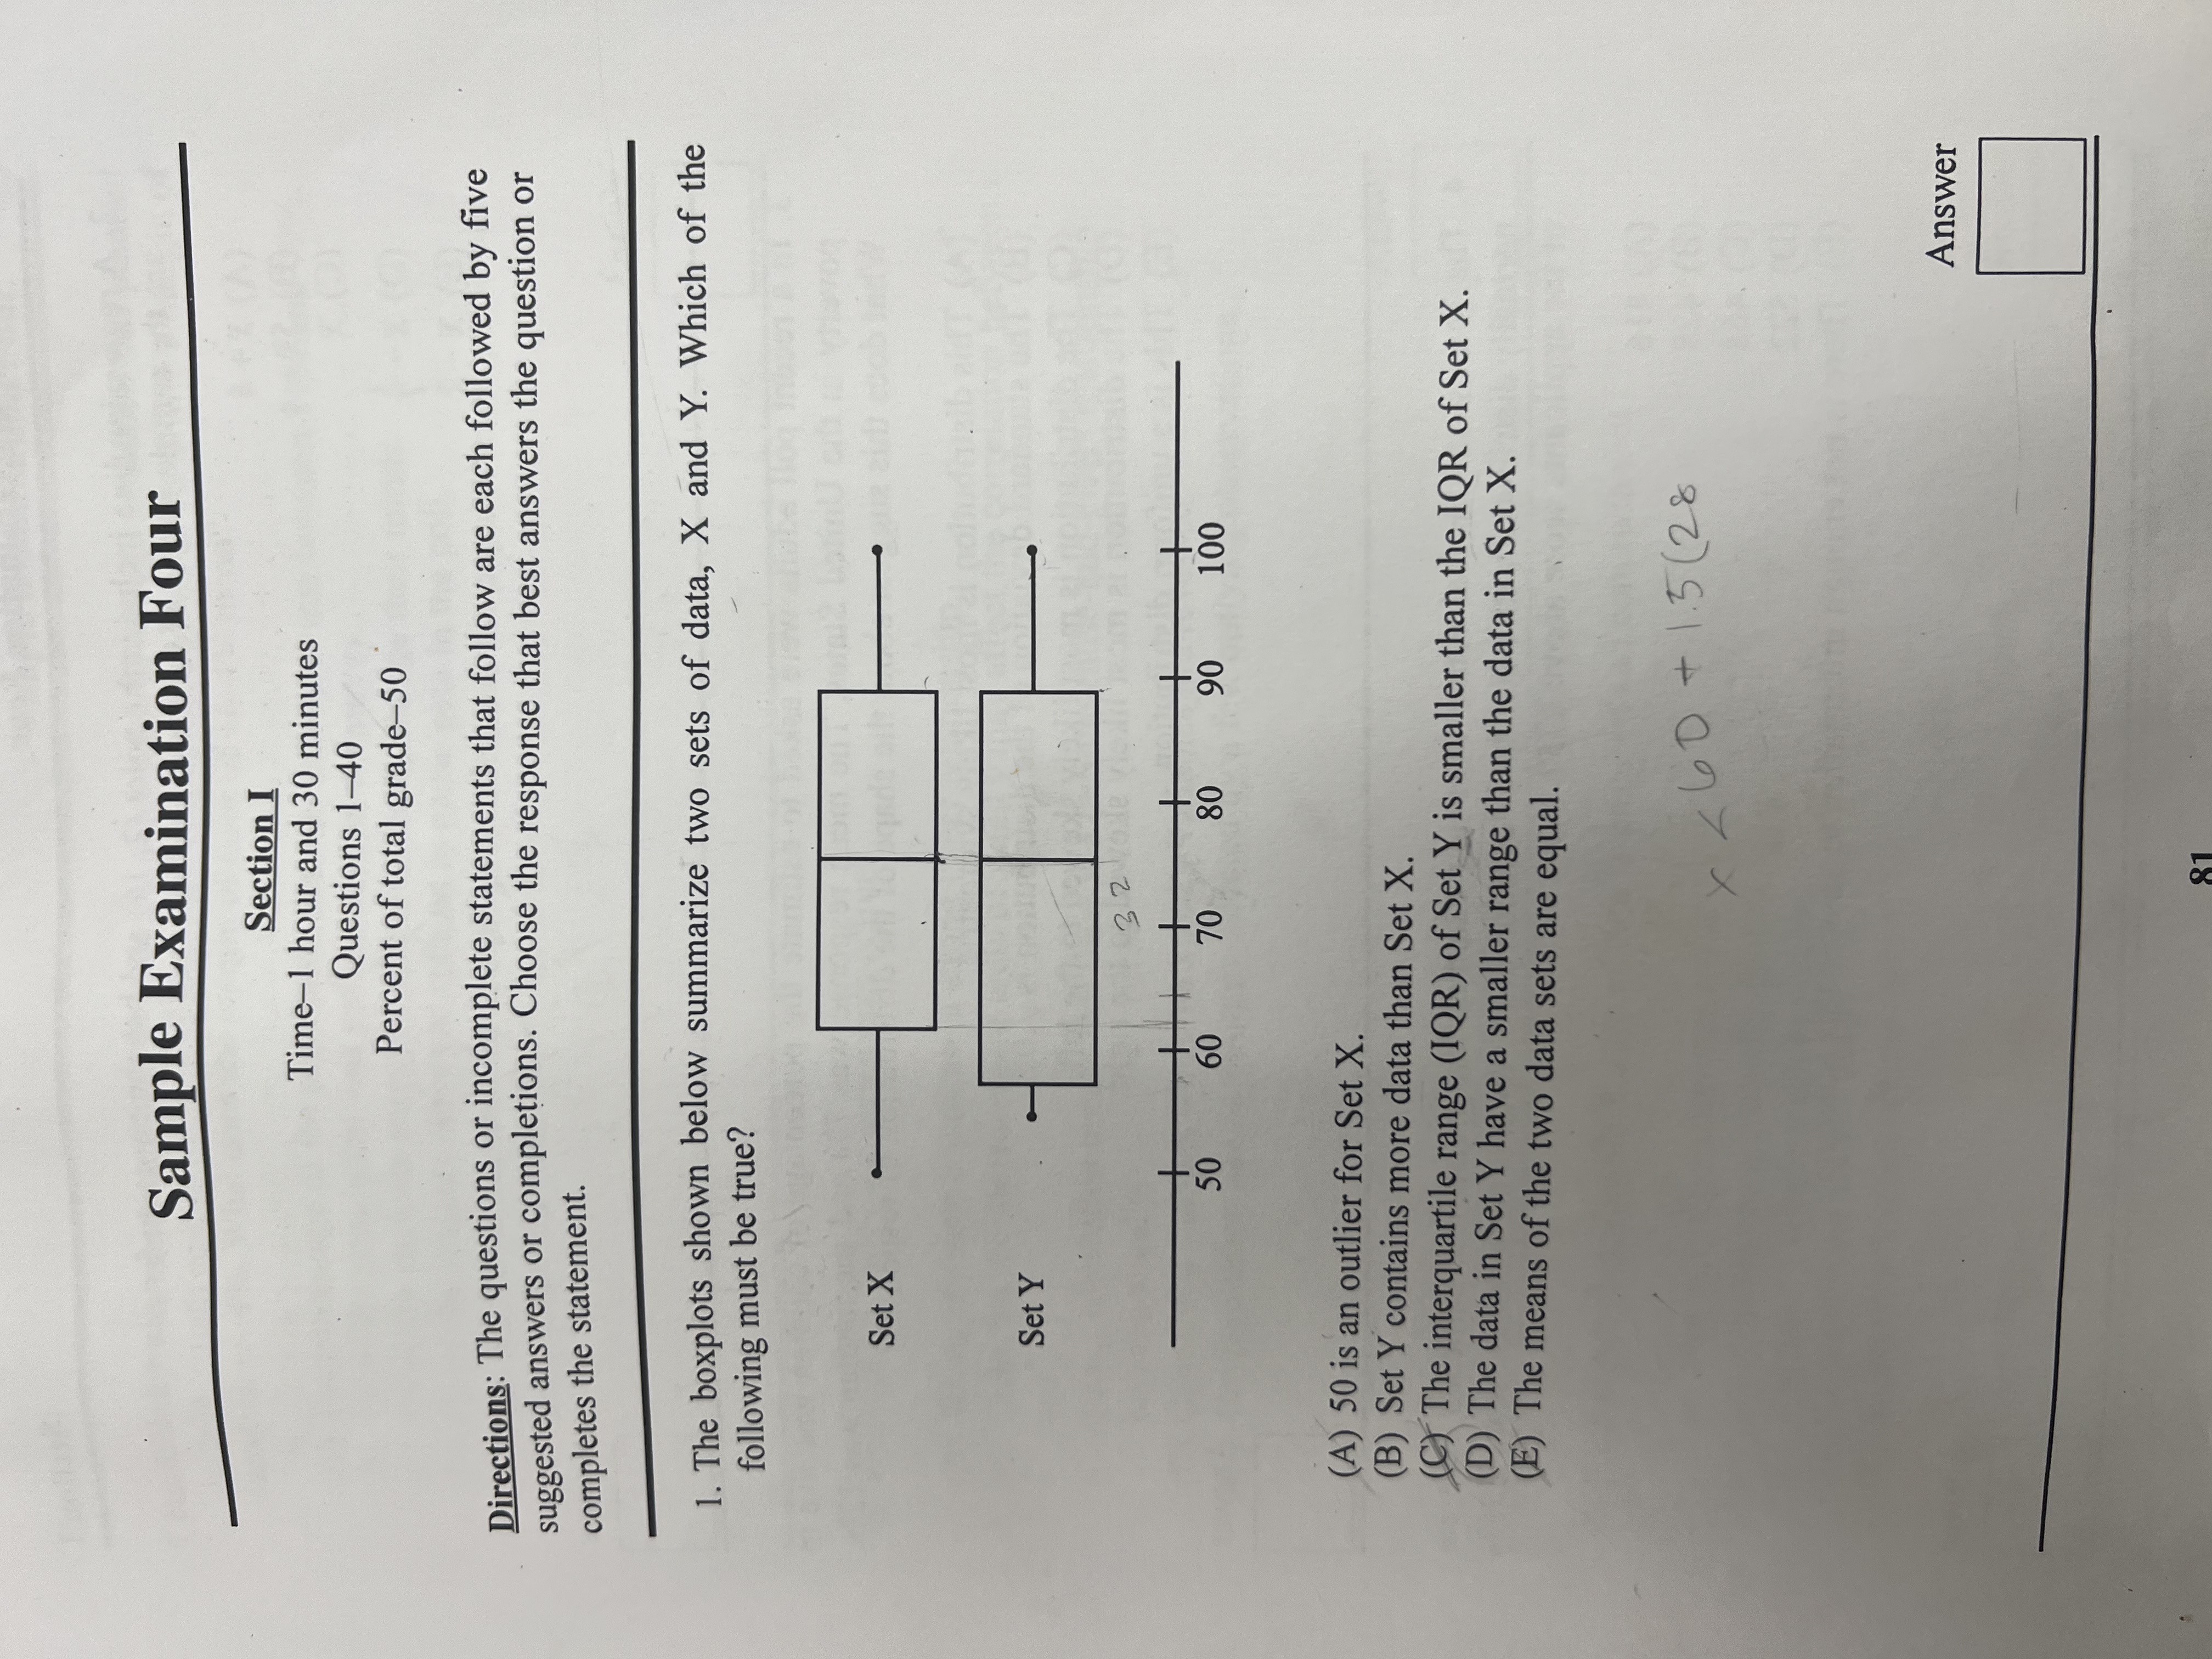
84 Sample Examination Four Section I 8. The histogram shows the ages of cars in the parking lot at a local high school. X 6 . 8 9 10 Which of the following statements are TRUE? I. The mean age is greater than the median age. IL. The median age is greater than the mean age. HI. The median is between 6 and 8 years. (A) I only (B) II only X : 5 542 () III only (D) I and II 6.5 = median (E) II and III AnswerSection I Sample Examination Four 91 23. A normal distribution has a mean / and a variance of 16. If the 35th percentile is equal to 8, then / is approximately equal to (A) -2.29 (B) -1.03 (C) 0.29 9.55 (E) 10.67 AnswerSection I Sample Examination Four 97 39. A type II error is (A) rejecting the null hypothesis when it is false (B) rejecting the null hypothesis when it is true (C) failing to reject the null hypothesis when it is false "D) failing to reject the null hypothesis when it is true (E) incorrectly stating the alternative hypothesis Answer 40. Consider the distribution below. X 0 2 3 4 P(X) 1.2 .3 .4 .5 Which of the following statements about the distribution is correct? (A) This distribution is not a valid probability distribution because the sum of the X's is greater than one. (B) This distribution is not a valid probability distribution because the sum of the probabilities is greater than one. (C) This distribution is a valid probability distribution because each of the P(X) values is between zero and one. (D) This distribution is a valid probability distribution because the sum of the X's is exactly 10. (E) This distribution is a valid probability distribution because the sum of the X's is exactly 10 and each P (X) is between zero and one. Answer86 Sample Examination Four Section I 12. Some supermarkets have been accused of selling meat that weighs less than is stated on the package. An inspector randomly selects 5 packages of ground beef and will consider the store to be in violation if more than 2 of the packages are underweight. Experience has shown him that the packages are either correctly marked or overweight 85% of the time. What is the probability that the store will be considered in violation? (A) 0.0244 (B) 0.0266 (C) 0.1382 (D) 0.8500 (E) 0.9734 . 4437 1. 391 5 13 8 Ri Answer3. In a recent poll adults were asked to estimate the percentage of children who live in poverty in the United States. The mean response was 7% and the median was 12%. What does this suggest about the shape of the distribution of responses? (A) This distribution is most likely symmetric. (B) The standard deviation of the distribution is .02. (C) The distribution is most likely skewed to the left. 12 (D) The distribution is most likely skewed to the right. (E) This is a uniform distribution. AnswerSection 94 Sample Examination Four 31. Which of the following statements are true? X X X 0 A B (A) The linear correlation coefficient for the data in plot A will be near zero. (B) The slope for the line of best fit for the data in plot B will be near zero. (C) The intercept for the line of best fit for the data in plot C will be positive. (D) Plot B suggests that there is no relationship between the two variables x and y. (E) All of the above are true. Answ\f(E) blinding Answer 15. Which of the following statements best describes the following histograms? i A B C (A) Histogram A suggests a rectangular distribution. (B) Histogram B suggests a normal distribution. (C) Histogram C suggests a normal distribution. (D) Histogram D suggests a right-skewed distribution. (E) Histogram C suggests a left-skewed distribution. Answer Unauthorized copying or any part of this page is88 Sample Examination Four Section I 16. A market research firm is hired by a nationally known cosmetics company to test new formulations of moisturizer. Using their extensive list of possible subjects, the market researchers first divide the subjects into 5 age groups and then randomly select names from each age group to participate in a study. This is an example of (A) a simple random sample (B) stratified sampling C) cluster sampling Ter (D) convenience sampling do us () (E) systematic sampling AnswerD) IS (E) always has a variance of one Answer 27. A fair die is tossed 3 times. The probability that a 1 occurs on exactly one roll of the die is (A ) (6 ) (2 ) (6) (B) 3 ( 6) (8) (0) 3 ( 6 ) ( 8 ) (D) (6 ) (E) (6 ) Answer 28. What sample size should we select if we wish to develop a 90% confidence interval for the average diameter of the washers produced by our company, yet we wish to have a margin of error of no more than +0.02 mm? Assume our manufacturing process results in a standard deviation of 0.035 mm. (A) 3 (B) 5 (C) 9 (D) 17 2 ( 1:645, 035 ) 2 (E) 95 . OZ Answer25. The t-distribution critical value for a 90% confidence level and a sample size of 17 is (A) 1.341 (B) 1.734 E (A (C) 1.740 (D) 1.746 (E) 2.583 Answer90 Sample Examination Four Section I 20. A normal population has a mean of 100 and a standard deviation of 16. If samples of size 64 are drawn from the population, what proportion of the samples should have mean values between 91 and 103? (A) 0.0668 (B) 0.4987 (C) 0.9050 (D) 0.9319 C 7 - 91 - 100 (E) 0.9332 3 4.5 Answer 21. A survey was taken to determine the number of hours per week students studied mathematics. The distribution was approximately normal with a mean of 20 hours and a standard deviation of four hours. Approximately what percent of the students studied between 27 and 30 hours? (A) 0.00338% 3.5 (B) 0.004594 (C) 0.4937% (D) 3.39% (E) 4.937% Answer 22. Size AAA batteries have a mean life of two years with a standard deviation of six months. The life spans of AAA batteries are normally distributed. If the money-back guarantee allows you to return the batteries if they do not last at least eight months, what is the probability that a randomly selected battery will qualify for the guarantee? (A) 0.0038 (B) 0.0049 (C) 0.3800 (D) 0.4900 (E) 0.49626. Which of the following statements is true? (A) Values of r near 0 indicate a strong linear relationship. (B) Changing the measurement units of x and y may affect the correlation between x and y. (C) Strong correlation means that there is a definite cause-and-effect relationship between x and y. (D) Correlation changes when the x and y variables are reversed. (E) The correlation can be strongly affected by a few outlying observations. AnswerSection I Sample Examination Four 89 18. A distribution that is symmetric and mound-shaped has a mean of 30 and a standard deviation of 2. According to the Empirical Rule, approximately 68% of the data lie between (A) 24 and 36 B) 26 and 34 (C) 28 and 32 "D) 20 and 40 (E) 25 and 35 30 Answer 19. The figure below shows the probability density functions of two symmetric distributions with the same mean. Which of the following statements are true? (A) median A > median B; OAF OB B) median A OB (C) median A = median B; OA> OB (D) median A = median B; JACOB (E) It cannot be determined from the information given. AnswerSection I Sample Examination Four 93 29. Data are obtained from a group of high school seniors comparing age and the number of hours spent on the telephone. The resulting regression equation is Predicted number of hours = 0.123 (age) + 2.57 with r = 0.866 What percentage of the variation in the number of hours spent on the telephone can be explained by this least-squares regression model? (A) 0.75% (B) 0.866% (C) 75% (D) 86.6% (E) This value cannot be found with the information given. AnswerSection I Sample Examination Four 95 33. The variance of a random variable is 100 and a sample of size 25 is taken. The standard error of the mean is D N 4 5 10 100 AnswerSample Examination Four Section I Time-1 hour and 30 minutes Questions 1-40 Percent of total grade-50 Directions: The questions or incomplete statements that follow are each followed by five suggested answers or completions. Choose the response that best answers the question or completes the statement. 1. The boxplots shown below summarize two sets of data, X and Y. Which of the following must be true? Set X Set Y 3 2 50 60 70 80 90 100 (A) 50 is an outlier for Set X. (B) Set Y contains more data than Set X. (C) The interquartile range (IQR) of Set Y is smaller than the IQR of Set X. (D) The data in Set Y have a smaller range than the data in Set X. (E) The means of the two data sets are equal. x 260+ 1.5(28
Step by Step Solution
There are 3 Steps involved in it

Get step-by-step solutions from verified subject matter experts