

Question: Answer Schedule Format Points available Remarks billion 0.50 1.75 0.50 use 05/31/21 data provided on Data tab - use value in BILLIONS use dividend growth
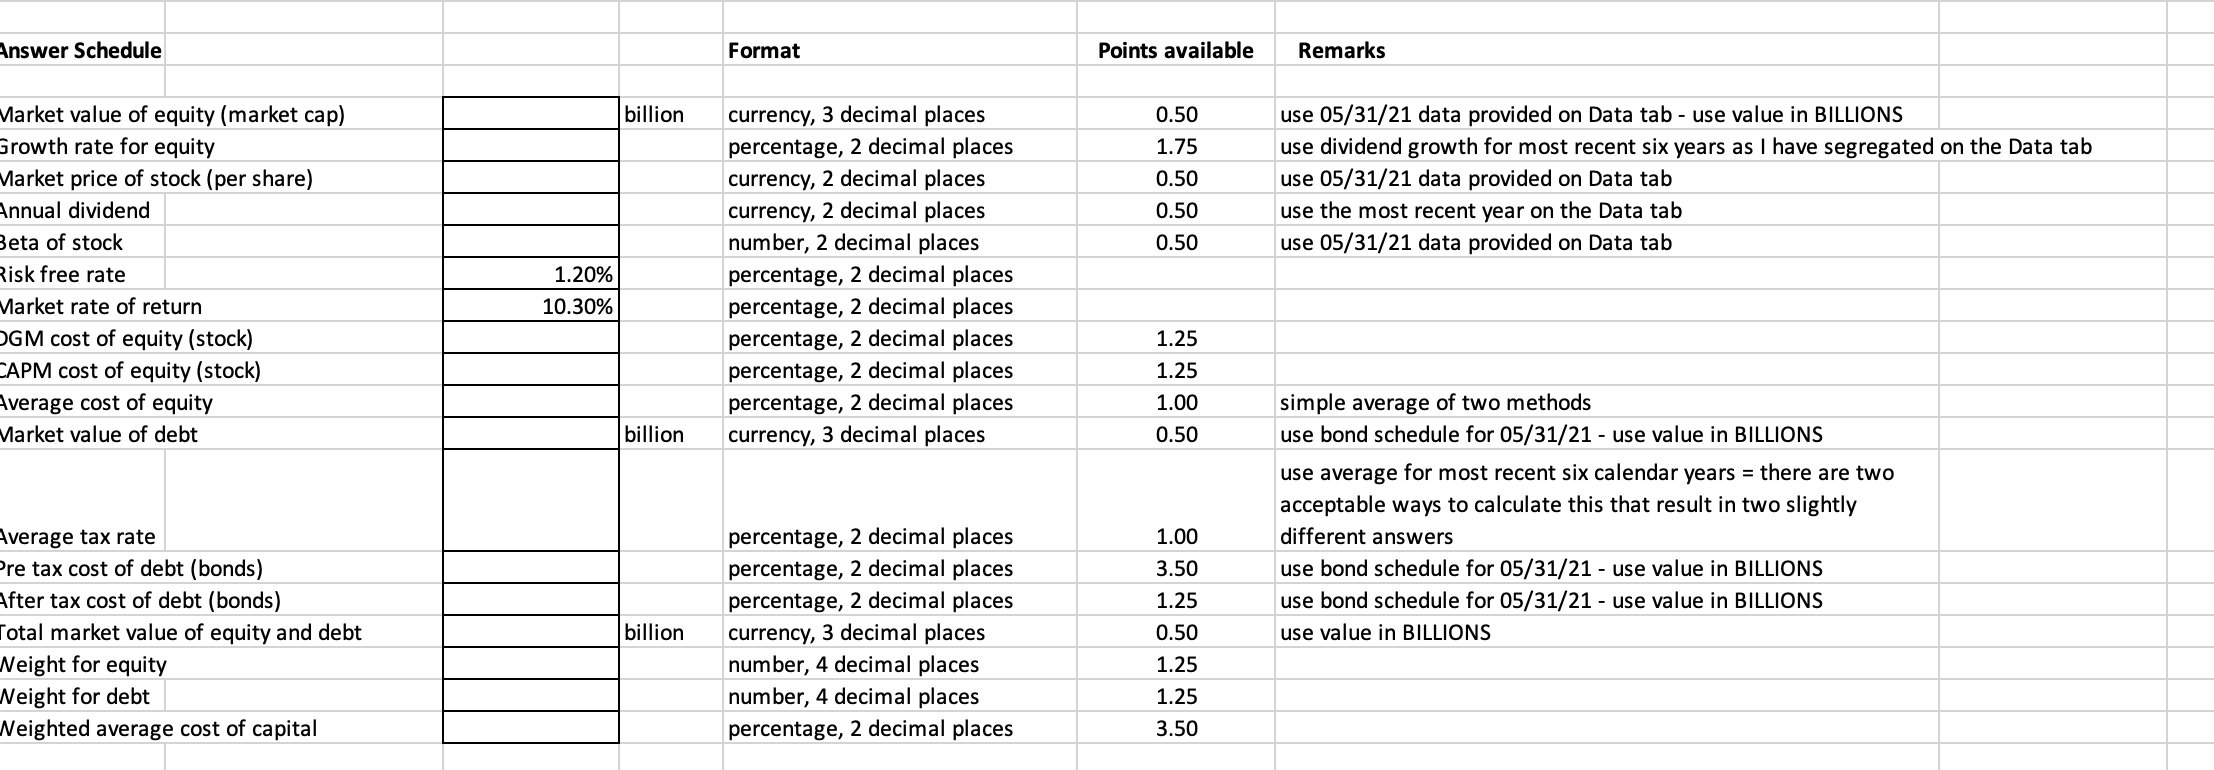
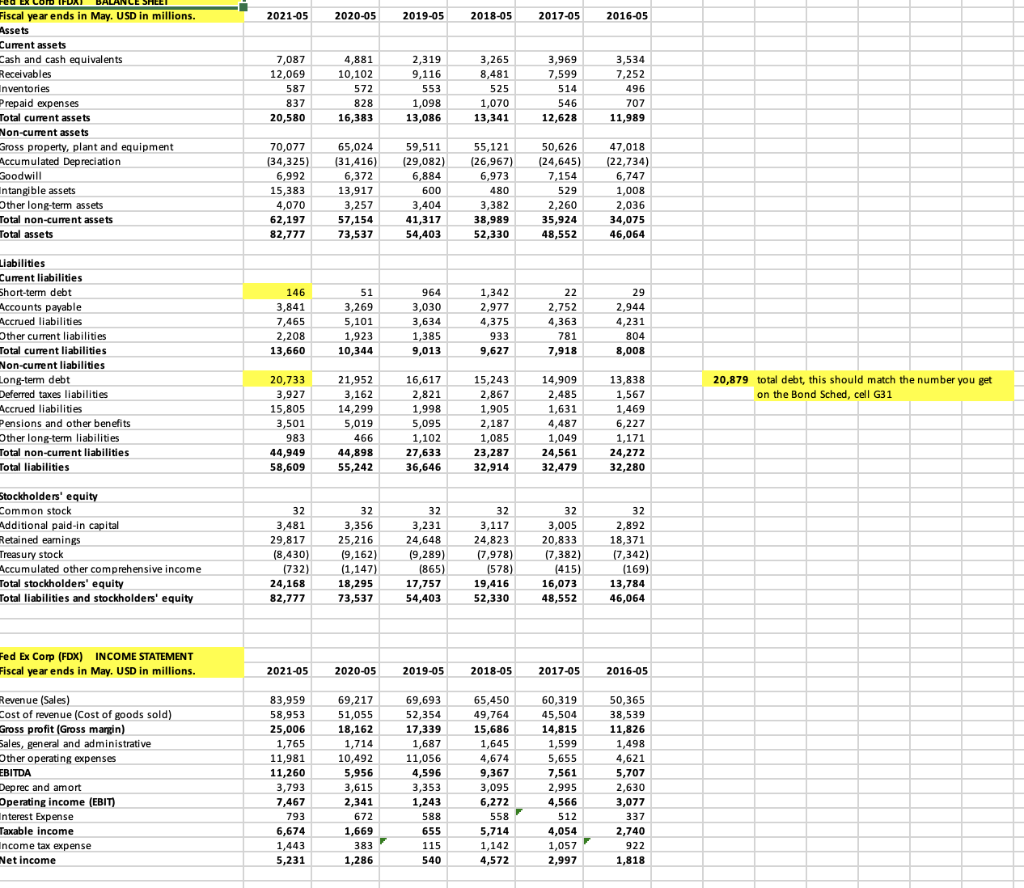
Answer Schedule Format Points available Remarks billion 0.50 1.75 0.50 use 05/31/21 data provided on Data tab - use value in BILLIONS use dividend growth for most recent six years as I have segregated on the Data tab use 05/31/21 data provided on Data tab use the most recent year on the Data tab use 05/31/21 data provided on Data tab 0.50 0.50 Market value of equity (market cap) Growth rate for equity Market price of stock (per share) Annual dividend Beta of stock Risk free rate Market rate of return OGM cost of equity (stock) CAPM cost of equity (stock) Average cost of equity Market value of debt 1.20% 10.30% currency, 3 decimal places percentage, 2 decimal places currency, 2 decimal places currency, 2 decimal places number, 2 decimal places percentage, 2 decimal places percentage, 2 decimal places percentage, 2 decimal places percentage, 2 decimal places percentage, 2 decimal places currency, 3 decimal places 1.25 1.25 1.00 billion 0.50 - simple average of two methods use bond schedule for 05/31/21 - use value in BILLIONS use average for most recent six calendar years = there are two acceptable ways to calculate this that result in two slightly different answers use bond schedule for 05/31/21 - use value in BILLIONS use bond schedule for 05/31/21 - use value in BILLIONS use value in BILLIONS 1.00 Average tax rate Pre tax cost of debt (bonds) After tax cost of debt (bonds) Total market value of equity and debt Neight for equity Neight for debt Weighted average cost of capital billion percentage, 2 decimal places percentage, 2 decimal places percentage, 2 decimal places currency, 3 decimal places number, 4 decimal places number, 4 decimal places percentage, 2 decimal places 3.50 1.25 0.50 1.25 1.25 3.50 2021-05 2020-05 2019-05 2018-05 2017-05 2016-05 Fed Ex Com Fiscal year ends in May. USD in millions. Assets Current assets Cash and cash equivalents Receivables Inventories Prepaid expenses Total current assets Non-current assets - Gross property, plant and equipment Accumulated Depreciation Soodwill Intangible assets ther long-term assets Total non-current assets Total assets 7,087 12,069 587 837 20,580 4,881 10,102 572 828 16,383 2,319 9,116 553 1,098 13,086 3,265 8,481 525 1,070 13,341 3,969 7,599 514 546 12,628 3,534 7,252 496 707 11,989 70,077 (34,325) 6,992 15,383 4,070 62,197 82,777 65,024 (31,416) 6,372 13,917 3,257 57,154 73,537 59,511 (29,082) 6,884 600 3,404 41,317 54,403 55,121 (26,967) 6,973 480 3,382 38,989 52,330 50,626 (24,645) 7,154 529 2,260 35,924 48,552 47,018 (22,734) 6,747 1,008 2,036 34,075 46,064 146 3,841 7,465 2,208 13,660 51 3,269 5,101 1,923 10,344 964 3,030 3,634 1,385 9,013 1,342 2,977 4,375 933 9,627 22 2,752 4,363 781 7,918 29 2,944 4,231 804 8,008 Liabilities Current liabilities Short-term debt Accounts payable Accrued liabilities Other current liabilities Total current liabilities Non-current liabilities - Long-term debt Deferred taxes liabilities Accrued liabilities Pensions and other benefits ther long-term liabilities Total non-current liabilities Total liabilities 20,879 total debt, this should match the number you get on the Bond Sched, cell G31 20,733 3,927 15,805 3,501 983 44,949 58,609 21,952 3,162 14,299 5,019 466 44,898 55,242 16,617 2,821 1,998 5,095 1,102 27,633 36,646 15,243 2,867 1,905 2,187 1,085 23,287 32,914 14,909 2,485 1,631 4,487 1,049 24,561 32,479 13,838 1,567 1,469 6,227 1,171 24,272 32,280 32 3,356 32 2,892 25,216 18,371 Stockholders' equity Common stock Additional paid-in capital Retained earnings Treasury stock Accumulated other comprehensive income Total stockholders' equity Total liabilities and stockholders' equity 32 3,481 29,817 (8,430) (732) 24,168 82,777 (9,162) (1,147) 18,295 73,537 32 3,231 24,648 (9,289) (865) 17,757 54,403 32 3,117 24,823 (7,978) (578) 19,416 52,330 32 3,005 20,833 (7,382) (415) 16,073 48,552 (7,342) (169) 13,784 46,064 Fed Ex Corp (FDX) INCOME STATEMENT Fiscal year ends in May. USD in millions. 2021-05 2020-05 2019-05 2018-05 2017-05 2016-05 Revenue (Sales) Cost of revenue (Cost of goods sold) Gross profit (Gross margin) Sales, general and administrative Other operating expenses EBITDA Deprec and amort Operating income (EBIT) Interest Expense Taxable income Income tax expense Net Income 83,959 58,953 25,00 1,765 11,981 11,260 3,793 7,467 793 6,674 1,443 5,231 69,217 51,055 18,162 1,714 10,492 5,956 3,615 2,341 672 1,669 383 1,286 69,693 52,354 17,339 1,687 11,056 4,596 3,353 1,243 588 655 115 540 65,450 49,764 15,686 1,645 4,674 9,367 3,095 6,272 558 5,714 1,142 4,572 60,319 45,504 14,815 1,599 5,655 7,561 2,995 4,566 512 4,054 1,057 2,997 50,365 38,539 11,826 1,498 4,621 5,707 2,630 3,077 337 2,740 922 1,818 Answer Schedule Format Points available Remarks billion 0.50 1.75 0.50 use 05/31/21 data provided on Data tab - use value in BILLIONS use dividend growth for most recent six years as I have segregated on the Data tab use 05/31/21 data provided on Data tab use the most recent year on the Data tab use 05/31/21 data provided on Data tab 0.50 0.50 Market value of equity (market cap) Growth rate for equity Market price of stock (per share) Annual dividend Beta of stock Risk free rate Market rate of return OGM cost of equity (stock) CAPM cost of equity (stock) Average cost of equity Market value of debt 1.20% 10.30% currency, 3 decimal places percentage, 2 decimal places currency, 2 decimal places currency, 2 decimal places number, 2 decimal places percentage, 2 decimal places percentage, 2 decimal places percentage, 2 decimal places percentage, 2 decimal places percentage, 2 decimal places currency, 3 decimal places 1.25 1.25 1.00 billion 0.50 - simple average of two methods use bond schedule for 05/31/21 - use value in BILLIONS use average for most recent six calendar years = there are two acceptable ways to calculate this that result in two slightly different answers use bond schedule for 05/31/21 - use value in BILLIONS use bond schedule for 05/31/21 - use value in BILLIONS use value in BILLIONS 1.00 Average tax rate Pre tax cost of debt (bonds) After tax cost of debt (bonds) Total market value of equity and debt Neight for equity Neight for debt Weighted average cost of capital billion percentage, 2 decimal places percentage, 2 decimal places percentage, 2 decimal places currency, 3 decimal places number, 4 decimal places number, 4 decimal places percentage, 2 decimal places 3.50 1.25 0.50 1.25 1.25 3.50 2021-05 2020-05 2019-05 2018-05 2017-05 2016-05 Fed Ex Com Fiscal year ends in May. USD in millions. Assets Current assets Cash and cash equivalents Receivables Inventories Prepaid expenses Total current assets Non-current assets - Gross property, plant and equipment Accumulated Depreciation Soodwill Intangible assets ther long-term assets Total non-current assets Total assets 7,087 12,069 587 837 20,580 4,881 10,102 572 828 16,383 2,319 9,116 553 1,098 13,086 3,265 8,481 525 1,070 13,341 3,969 7,599 514 546 12,628 3,534 7,252 496 707 11,989 70,077 (34,325) 6,992 15,383 4,070 62,197 82,777 65,024 (31,416) 6,372 13,917 3,257 57,154 73,537 59,511 (29,082) 6,884 600 3,404 41,317 54,403 55,121 (26,967) 6,973 480 3,382 38,989 52,330 50,626 (24,645) 7,154 529 2,260 35,924 48,552 47,018 (22,734) 6,747 1,008 2,036 34,075 46,064 146 3,841 7,465 2,208 13,660 51 3,269 5,101 1,923 10,344 964 3,030 3,634 1,385 9,013 1,342 2,977 4,375 933 9,627 22 2,752 4,363 781 7,918 29 2,944 4,231 804 8,008 Liabilities Current liabilities Short-term debt Accounts payable Accrued liabilities Other current liabilities Total current liabilities Non-current liabilities - Long-term debt Deferred taxes liabilities Accrued liabilities Pensions and other benefits ther long-term liabilities Total non-current liabilities Total liabilities 20,879 total debt, this should match the number you get on the Bond Sched, cell G31 20,733 3,927 15,805 3,501 983 44,949 58,609 21,952 3,162 14,299 5,019 466 44,898 55,242 16,617 2,821 1,998 5,095 1,102 27,633 36,646 15,243 2,867 1,905 2,187 1,085 23,287 32,914 14,909 2,485 1,631 4,487 1,049 24,561 32,479 13,838 1,567 1,469 6,227 1,171 24,272 32,280 32 3,356 32 2,892 25,216 18,371 Stockholders' equity Common stock Additional paid-in capital Retained earnings Treasury stock Accumulated other comprehensive income Total stockholders' equity Total liabilities and stockholders' equity 32 3,481 29,817 (8,430) (732) 24,168 82,777 (9,162) (1,147) 18,295 73,537 32 3,231 24,648 (9,289) (865) 17,757 54,403 32 3,117 24,823 (7,978) (578) 19,416 52,330 32 3,005 20,833 (7,382) (415) 16,073 48,552 (7,342) (169) 13,784 46,064 Fed Ex Corp (FDX) INCOME STATEMENT Fiscal year ends in May. USD in millions. 2021-05 2020-05 2019-05 2018-05 2017-05 2016-05 Revenue (Sales) Cost of revenue (Cost of goods sold) Gross profit (Gross margin) Sales, general and administrative Other operating expenses EBITDA Deprec and amort Operating income (EBIT) Interest Expense Taxable income Income tax expense Net Income 83,959 58,953 25,00 1,765 11,981 11,260 3,793 7,467 793 6,674 1,443 5,231 69,217 51,055 18,162 1,714 10,492 5,956 3,615 2,341 672 1,669 383 1,286 69,693 52,354 17,339 1,687 11,056 4,596 3,353 1,243 588 655 115 540 65,450 49,764 15,686 1,645 4,674 9,367 3,095 6,272 558 5,714 1,142 4,572 60,319 45,504 14,815 1,599 5,655 7,561 2,995 4,566 512 4,054 1,057 2,997 50,365 38,539 11,826 1,498 4,621 5,707 2,630 3,077 337 2,740 922 1,818
Step by Step Solution
There are 3 Steps involved in it

Get step-by-step solutions from verified subject matter experts