

Question: please show the equations. thank you Answer Schedule Format Remarks billion use 05/31/21 data provided on Data tab-use value in BILLIONS use dividend growth for
please show the equations.
thank you
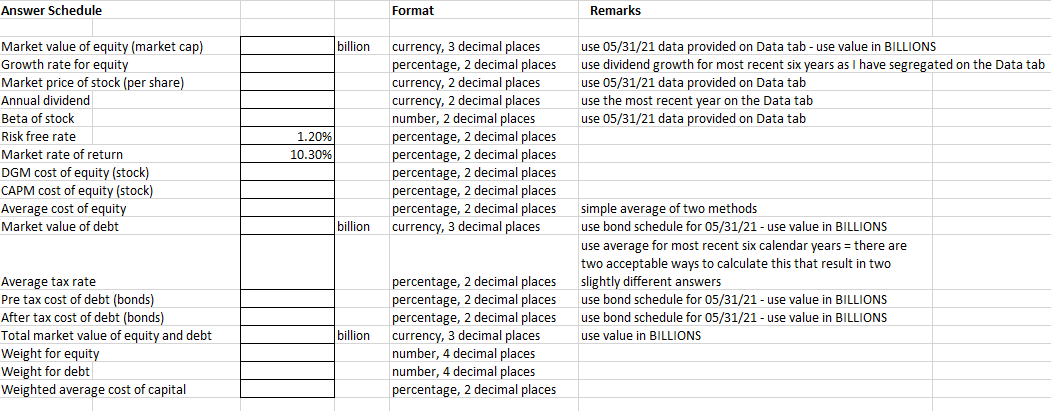
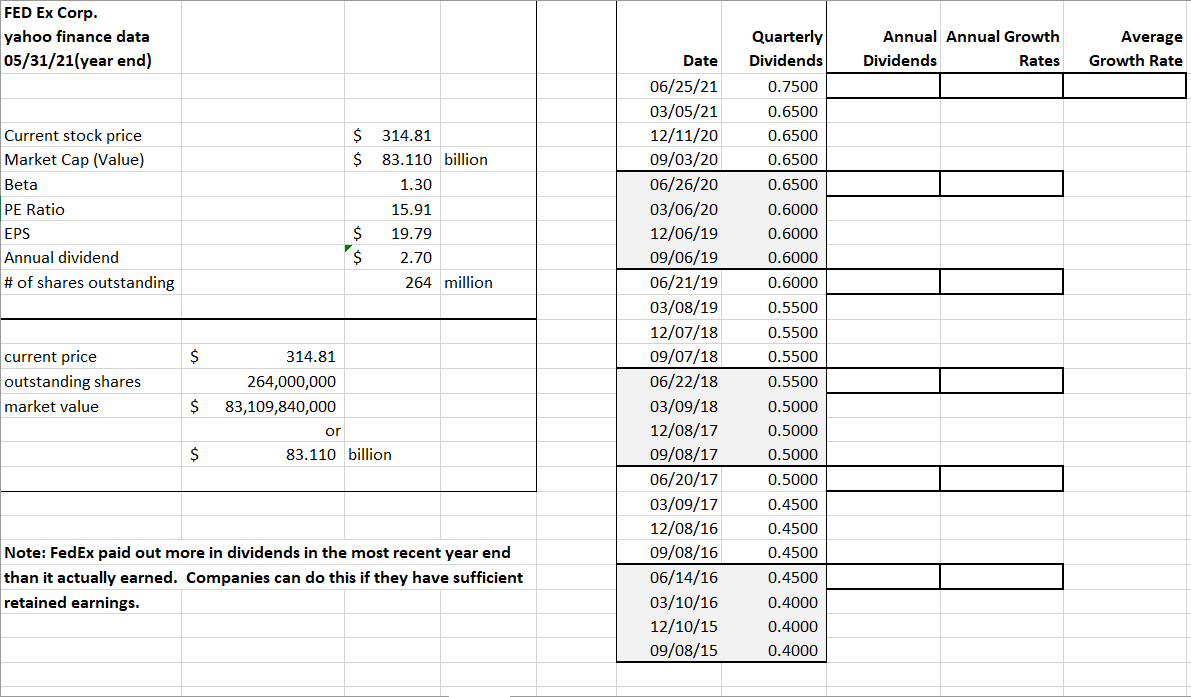
Answer Schedule Format Remarks billion use 05/31/21 data provided on Data tab-use value in BILLIONS use dividend growth for most recent six years as I have segregated on the Data tab use 05/31/21 data provided on Data tab use the most recent year on the Data tab use 05/31/21 data provided on Data tab Market value of equity (market cap) Growth rate for equity Market price of stock (per share) Annual dividend Beta of stock Risk free rate Market rate of return DGM cost of equity (stock) CAPM cost of equity (stock) Average cost of equity Market value of debt 1.20% 10.30% currency, 3 decimal places percentage, 2 decimal places currency, 2 decimal places currency, 2 decimal places number, 2 decimal places percentage, 2 decimal places percentage, 2 decimal places percentage, 2 decimal places percentage, 2 decimal places percentage, 2 decimal places currency, 3 decimal places billion simple average of two methods use bond schedule for 05/31/21 - use value in BILLIONS use average for most recent six calendar years = there are two acceptable ways to calculate this that result in two slightly different answers use bond schedule for 05/31/21 - use value in BILLIONS use bond schedule for 05/31/21 - use value in BILLIONS use value in BILLIONS Average tax rate Pre tax cost of debt (bonds) After tax cost of debt (bonds) Total market value of equity and debt Weight for equity Weight for debt Weighted average cost of capital billion percentage, 2 decimal places percentage, 2 decimal places percentage, 2 decimal places currency, 3 decimal places number, 4 decimal places number, 4 decimal places percentage, 2 decimal places FED Ex Corp. yahoo finance data 05/31/21(year end) Quarterly Dividends Annual Annual Growth Dividends Rates Average Growth Rate Date $ $ 314.81 83.110 billion 0.7500 0.6500 0.6500 0.6500 0.6500 1.30 Current stock price Market Cap (Value) Beta PE Ratio EPS Annual dividend # of shares outstanding $ $ 15.91 19.79 2.70 0.6000 0.6000 0.6000 264 million 0.6000 0.5500 0.5500 0.5500 $ current price outstanding shares market value 06/25/21 03/05/21 12/11/20 09/03/20 06/26/20 03/06/20 12/06/19 09/06/19 06/21/19 03/08/19 12/07/18 09/07/18 06/22/18 03/09/18 12/08/17 09/08/17 06/20/17 03/09/17 12/08/16 09/08/16 06/14/16 03/10/16 12/10/15 09/08/15 314.81 264,000,000 83,109,840,000 or 83.110 billion $ 0.5500 0.5000 0.5000 0.5000 $ 0.5000 0.4500 0.4500 0.4500 Note: FedEx paid out more in dividends in the most recent year end than it actually earned. Companies can do this if they have sufficient retained earnings. 0.4500 0.4000 0.4000 0.4000 Answer Schedule Format Remarks billion use 05/31/21 data provided on Data tab-use value in BILLIONS use dividend growth for most recent six years as I have segregated on the Data tab use 05/31/21 data provided on Data tab use the most recent year on the Data tab use 05/31/21 data provided on Data tab Market value of equity (market cap) Growth rate for equity Market price of stock (per share) Annual dividend Beta of stock Risk free rate Market rate of return DGM cost of equity (stock) CAPM cost of equity (stock) Average cost of equity Market value of debt 1.20% 10.30% currency, 3 decimal places percentage, 2 decimal places currency, 2 decimal places currency, 2 decimal places number, 2 decimal places percentage, 2 decimal places percentage, 2 decimal places percentage, 2 decimal places percentage, 2 decimal places percentage, 2 decimal places currency, 3 decimal places billion simple average of two methods use bond schedule for 05/31/21 - use value in BILLIONS use average for most recent six calendar years = there are two acceptable ways to calculate this that result in two slightly different answers use bond schedule for 05/31/21 - use value in BILLIONS use bond schedule for 05/31/21 - use value in BILLIONS use value in BILLIONS Average tax rate Pre tax cost of debt (bonds) After tax cost of debt (bonds) Total market value of equity and debt Weight for equity Weight for debt Weighted average cost of capital billion percentage, 2 decimal places percentage, 2 decimal places percentage, 2 decimal places currency, 3 decimal places number, 4 decimal places number, 4 decimal places percentage, 2 decimal places FED Ex Corp. yahoo finance data 05/31/21(year end) Quarterly Dividends Annual Annual Growth Dividends Rates Average Growth Rate Date $ $ 314.81 83.110 billion 0.7500 0.6500 0.6500 0.6500 0.6500 1.30 Current stock price Market Cap (Value) Beta PE Ratio EPS Annual dividend # of shares outstanding $ $ 15.91 19.79 2.70 0.6000 0.6000 0.6000 264 million 0.6000 0.5500 0.5500 0.5500 $ current price outstanding shares market value 06/25/21 03/05/21 12/11/20 09/03/20 06/26/20 03/06/20 12/06/19 09/06/19 06/21/19 03/08/19 12/07/18 09/07/18 06/22/18 03/09/18 12/08/17 09/08/17 06/20/17 03/09/17 12/08/16 09/08/16 06/14/16 03/10/16 12/10/15 09/08/15 314.81 264,000,000 83,109,840,000 or 83.110 billion $ 0.5500 0.5000 0.5000 0.5000 $ 0.5000 0.4500 0.4500 0.4500 Note: FedEx paid out more in dividends in the most recent year end than it actually earned. Companies can do this if they have sufficient retained earnings. 0.4500 0.4000 0.4000 0.4000
Step by Step Solution
There are 3 Steps involved in it

Get step-by-step solutions from verified subject matter experts