

Question: Answer the below questions (4) based on the tables (statistics) provided below, preferably in paragraphs. Describe your statistical results in narrative (sentence) form for each
Answer the below questions (4) based on the tables (statistics) provided below, preferably in paragraphs.
- Describe your statistical results in narrative (sentence) form for each problem.
- Interpret the results of each statistical analysis (do you reject the null; do you accept the null?). Explain in lay terms what rejecting/accepting the null means in your case.
- Look at the means of each group. Is this what you expected the outcome to be? Why or why not?
- What are some limitations of using the outcome of these test results? What might some additional variables be that weren't accounted for? Is this sample size powerful enough to make a determination about the larger population?
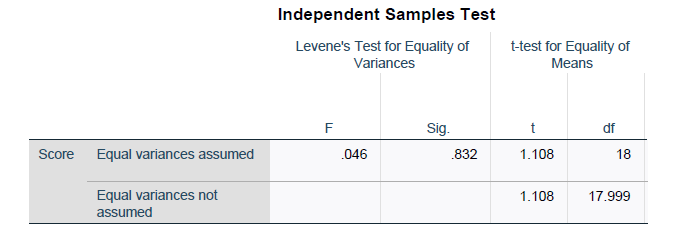
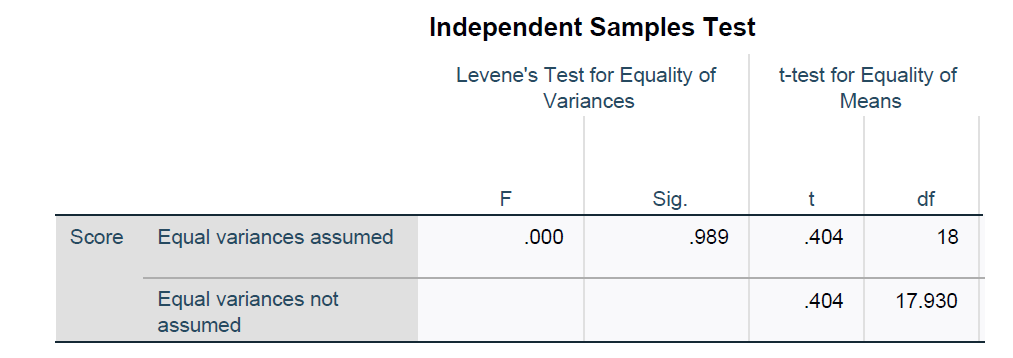
Independent Samples Test Levene's Test for Equality of t-test for Equality of Variances Means F Sig df Score Equal variances assumed 046 832 1.108 18 Equal variances not 1.108 17.999 assumedIndependent Samples Test Levene's Test for Equality of t-test for Equality of Variances Means F Sig. df Score Equal variances assumed 000 .989 .404 18 Equal variances not .404 17.930 assumed
Step by Step Solution
There are 3 Steps involved in it
1 Expert Approved Answer
Step: 1 Unlock

Question Has Been Solved by an Expert!
Get step-by-step solutions from verified subject matter experts
Step: 2 Unlock
Step: 3 Unlock