

Question: Answer the below questions (5) based on the tables (statistics) provided below, preferably in paragraphs. Interpret the results of the statistical analysis (do you reject
Answer the below questions (5) based on the tables (statistics) provided below, preferably in paragraphs.
- Interpret the results of the statistical analysis (do you reject the null; do you accept the null?). Explain in lay terms what rejecting/accepting the null means in your case.
- Look at the means of each group. Is this what you expected the outcome to be? Why or why not?
- What additional tests should be run to further determine which of the means are different from each other? Did SPSS run those tests? What can you ascertain about which means are different from each other and why?
- Describe your statistical results in narrative (sentence) form for the problem for the results.
- What are some limitations of using the outcome of these test results? What might some additional variables be that weren't accounted for? Is this sample size powerful enough to make a determination about the larger population?
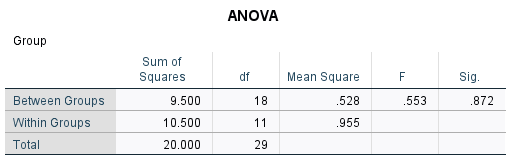
ANOVA Group Sum of Squares Mean Square F sig. Between Groups 9.500 18 .528 553 872 Within Groups 10.500 11 .955 Total 20.000 29
Step by Step Solution
There are 3 Steps involved in it
1 Expert Approved Answer
Step: 1 Unlock

Question Has Been Solved by an Expert!
Get step-by-step solutions from verified subject matter experts
Step: 2 Unlock
Step: 3 Unlock