

Question: Answer the below questions using the data provided below: Now, it is time to test the data with a one-proportion z-test. Recall that you are
Answer the below questions using the data provided below:
- Now, it is time to test the data with a one-proportion z-test. Recall that you are testing the expected
value (outside figure) and using it with the observed value to perform the hypothesis test.
A.) State the null and alternative hypothesis. Remember that the null is the expectation/outside
figure and the alternative is something else, the comparison in part (c) will dictate the
alternative statement
B) Perform the hypothesis test. What is the test statistic and corresponding p-value?
C) What is the test decision and conclusion in context of the results at a 5% significance level?
2. Construct a Confidence Interval to Estimate a Parameter - Now that you have tested the outside figure (expectation) with a hypothesis test, you can use your data to estimate the true population proportion with a one-proportion z-Confidence interval.
A.) Use your data collected from Part One of the project to construct a 95% confidence interval.
Write the interval in percent form, rounded to the nearest tenth percent.
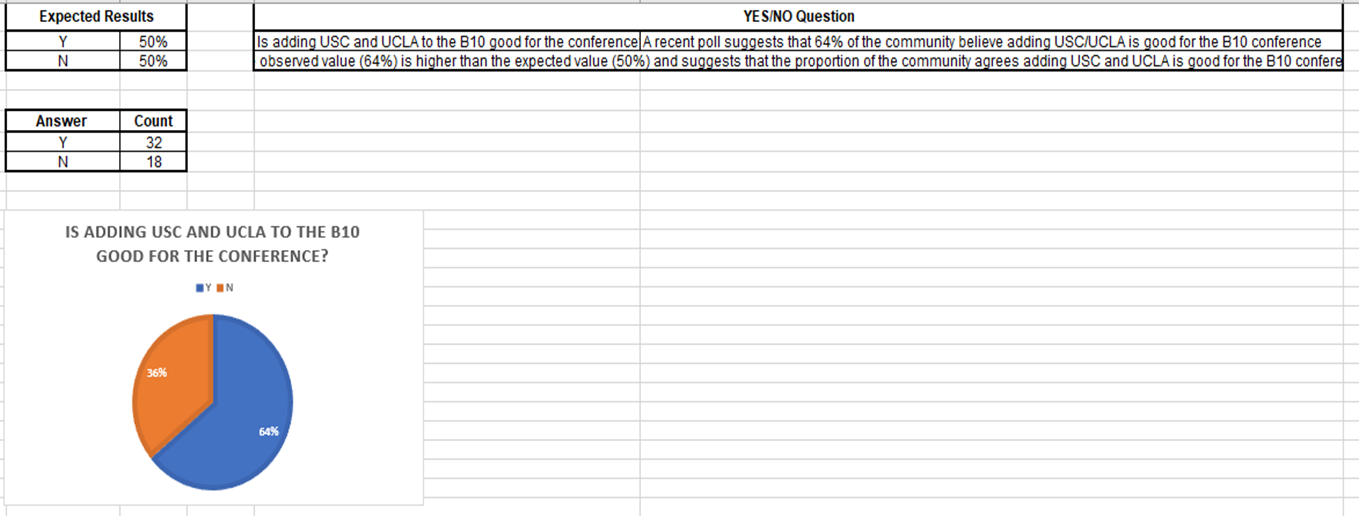
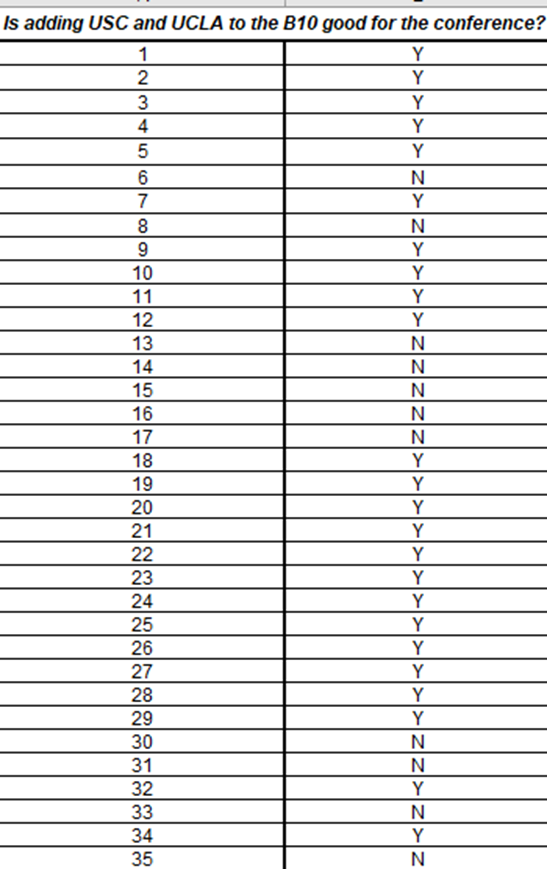
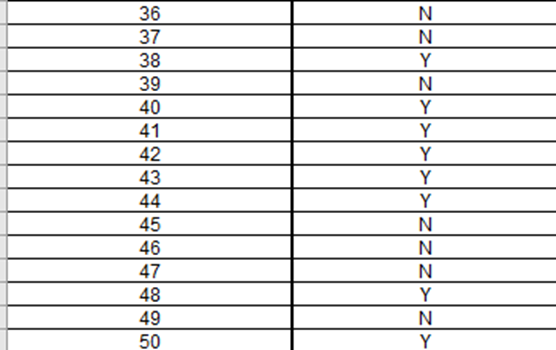
Expected Results YES/NO Question Y 50% Is adding USC and UCLA to the B10 good for the conference A recent poll suggests that 64% of the community believe adding USC/UCLA is good for the B10 conference N 50% observed value (64%) is higher than the expected value (50%) and suggests that the proportion of the community agrees adding USC and UCLA is good for the B10 confere Answer Count Y 32 N 18 IS ADDING USC AND UCLA TO THE B10 GOOD FOR THE CONFERENCE? BY ON 36% 64%%Is adding USC and UCLA to the B10 good for the conference?
Step by Step Solution
There are 3 Steps involved in it

Get step-by-step solutions from verified subject matter experts