

Question: Answer the black box questionIs it reasonable to use this dat to predict values for temperature less than 11C? Why or why not Give the
Answer the black box questionIs it reasonable to use this dat to predict values for temperature less than 11C? Why or why not
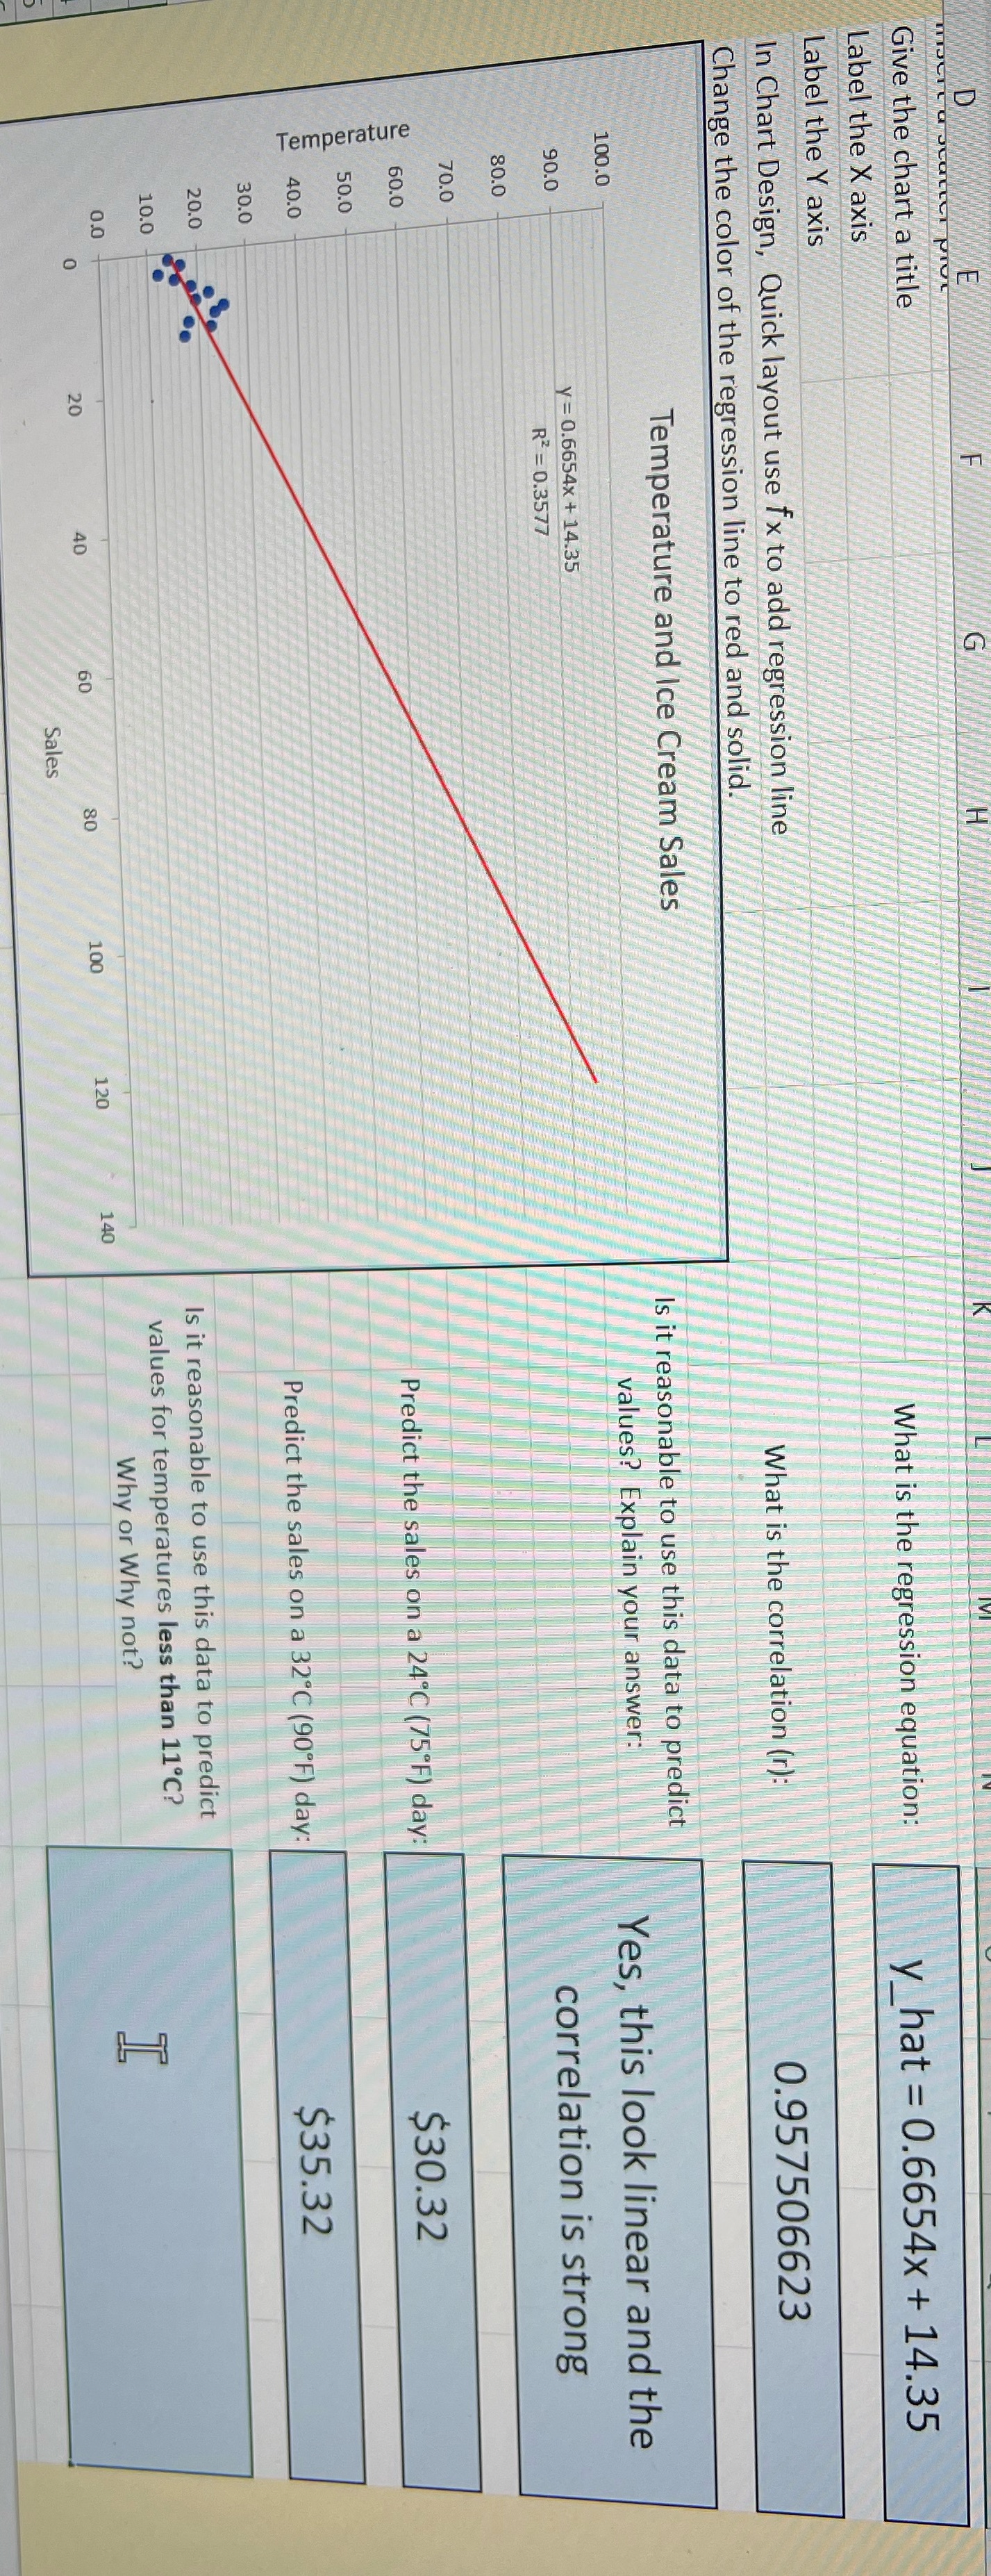
Give the chart a title Label the X axis What is the regression equation: y_hat = 0.6654x + 14.35 Label the Y axis In Chart Design, Quick layout use fx to add regression line Change the color of the regression line to red and solid. What is the correlation (r): 0.957506623 Temperature and Ice Cream Sales Is it reasonable to use this data to predict 100.0 values? Explain your answer: y = 0.6654x + 14.35 Yes, this look linear and the 90.0 R2 = 0.3577 80.0 correlation is strong 70.0 60.0 Predict the sales on a 24 C (75 F) day: $30.32 Temperature 50.0 40.0 30.0 Predict the sales on a 32 C (90*F) day: $35.32 20.0 Is it reasonable to use this data to predict 10.0 values for temperatures less than 11'C? 0.0 H 40 80 100 120 140 Why or Why not? 60 Sales
Step by Step Solution
There are 3 Steps involved in it

Get step-by-step solutions from verified subject matter experts