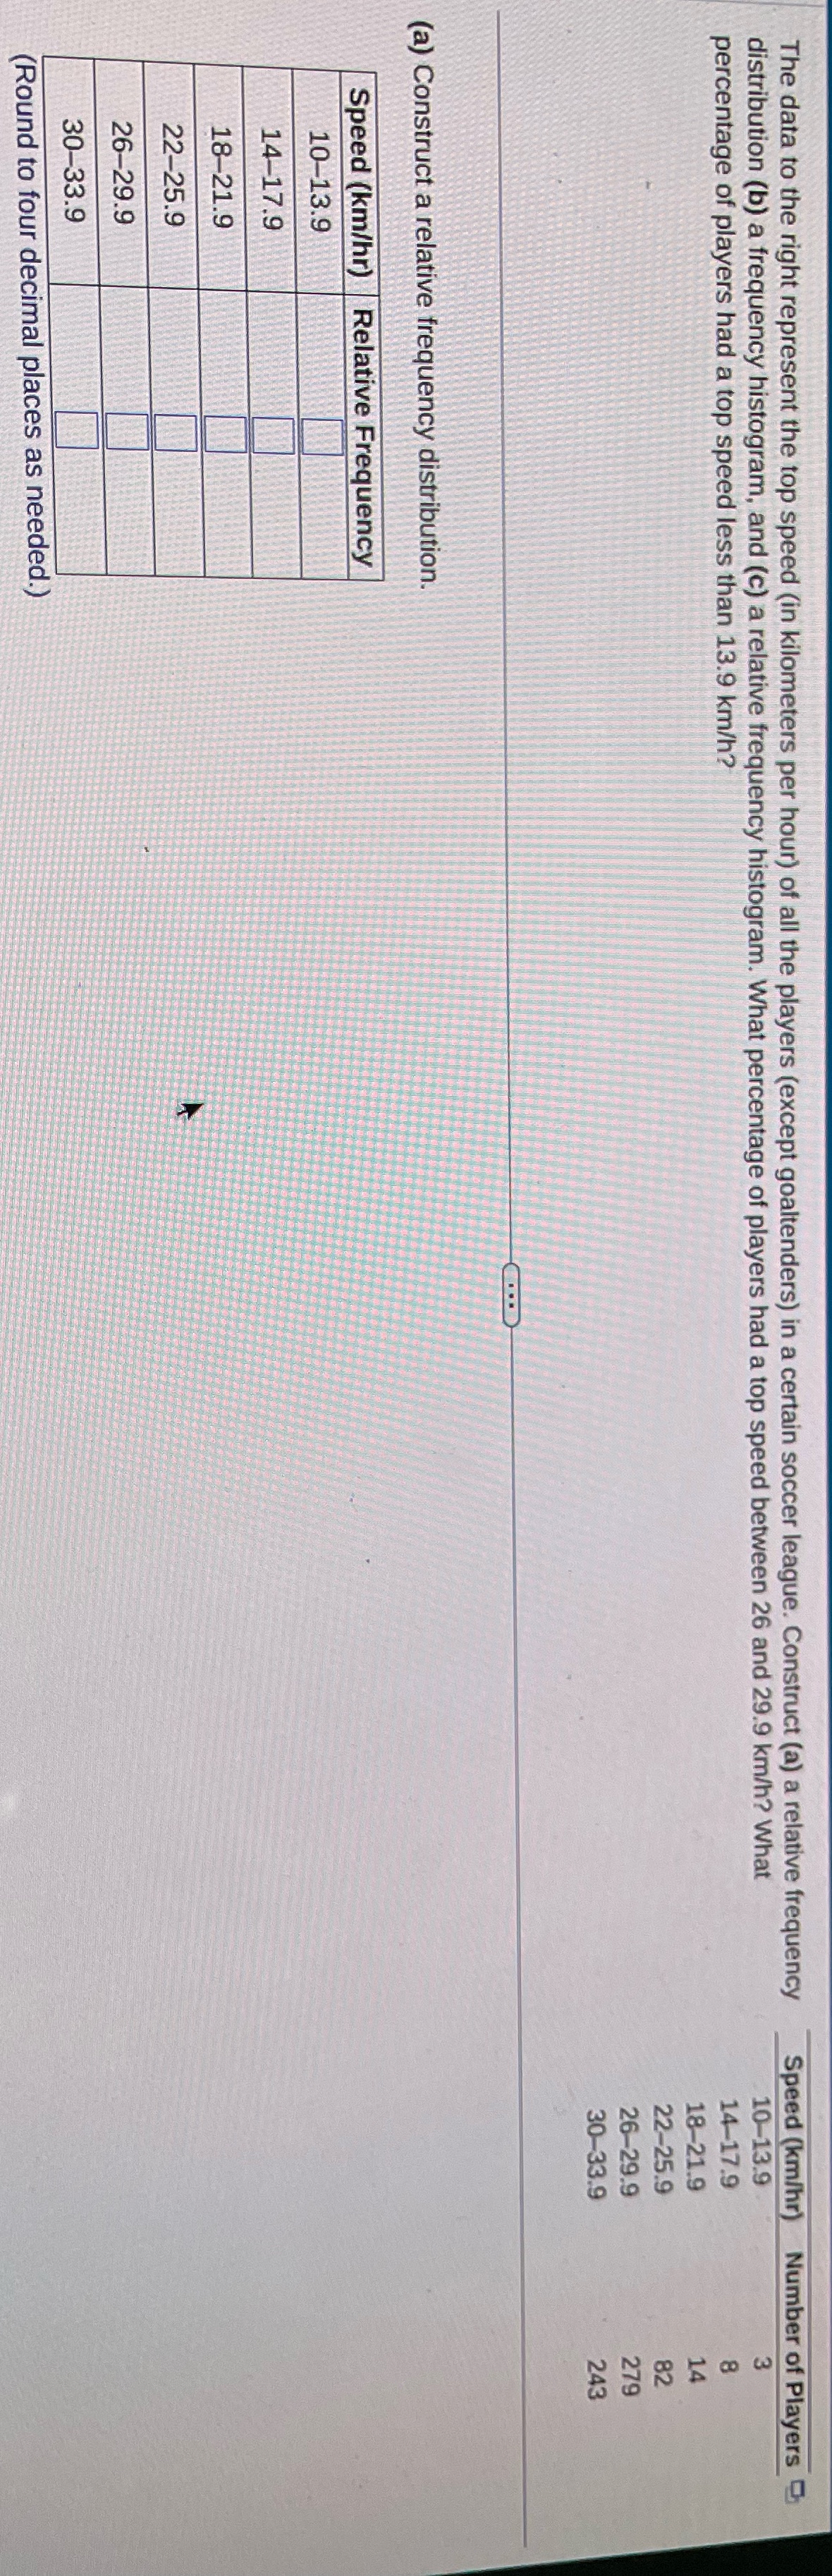
Question: Answer The data to the right represent the top speed (in kilometers per hour) of all the players (except goaltenders) in a certain soccer league.

Answer

Answer The data to the right represent the top
The data to the right represent the top speed (in kilometers per hour) of all the players (except goaltenders) in a certain soccer league. Construct (a) a relative frequency Speed (km/hr) Number of Players distribution (b) a frequency histogram, and (c) a relative frequency histogram. What percentage of players had a top speed between 26 and 29.9 km/h? What 10-13.9 percentage of players had a top speed less than 13.9 km/h? 14-17.9 18-21.9 22-25.9 82 26-29.9 279 30-33.9 243 (a) Construct a relative frequency distribution. Speed (km/hr) Relative Frequency 10-13.9 14-17.9 18-21.9 22-25.9 26-29.9 30-33.9 (Round to four decimal places as needed.)

Step by Step Solution

There are 3 Steps involved in it

1 Expert Approved Answer
Step: 1 Unlock blur-text-image
Question Has Been Solved by an Expert!

Get step-by-step solutions from verified subject matter experts

Step: 2 Unlock
Step: 3 Unlock

Students Have Also Explored These Related Mathematics Questions!