

Question: The data to the right represent the top speed (in kilometers per hour) of all the players (except goaltenders) in a certain soccer league. Construct
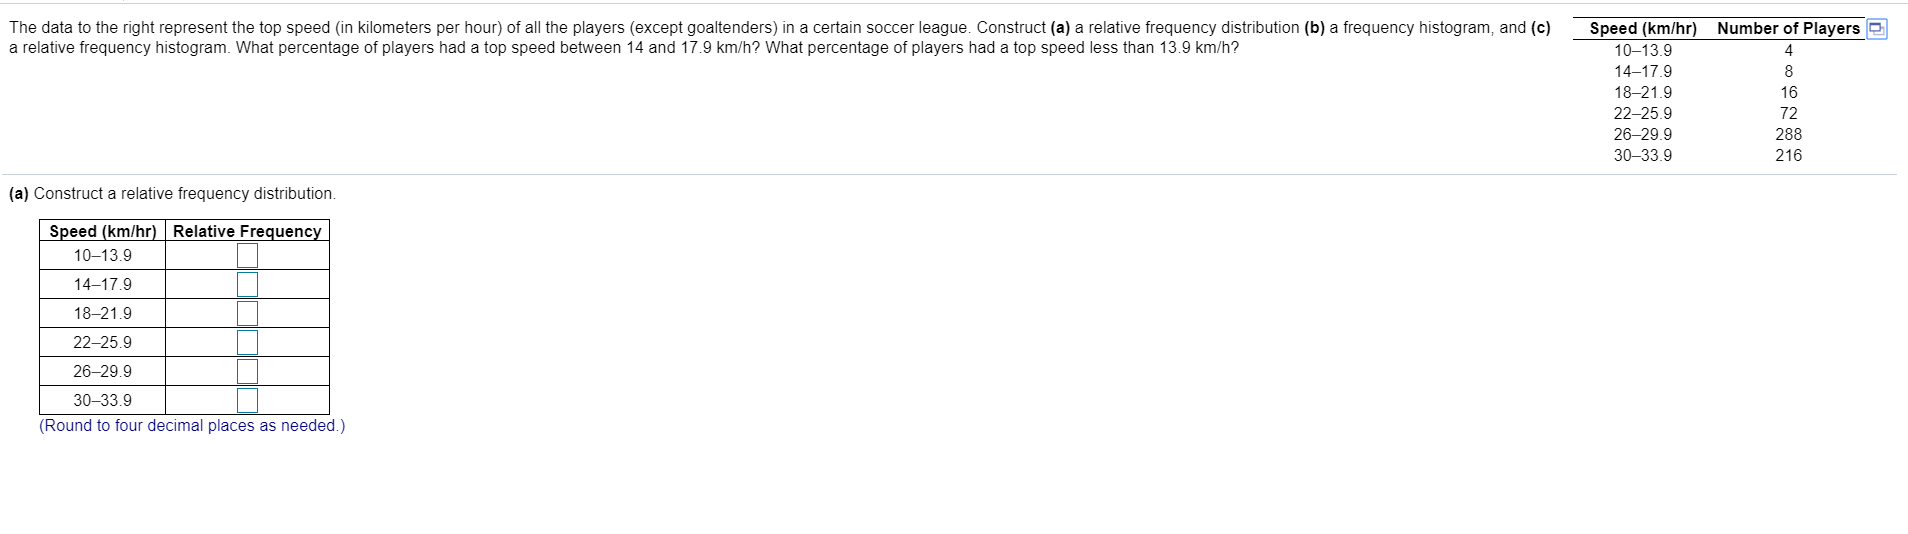
The data to the right represent the top speed (in kilometers per hour) of all the players (except goaltenders) in a certain soccer league. Construct (a) a relative frequency distribution (b) a frequency histogram, and (c) Speed (km/hr) Number of Players a relative frequency histogram. What percentage of players had a top speed between 14 and 17.9 km/h? What percentage of players had a top speed less than 13.9 km/h? 10-13.9 4 14-17.9 8 18-21.9 16 22-25.9 72 26-29.9 288 30-33.9 216 (a) Construct a relative frequency distribution. Speed (km/hr) Relative Frequency 10-13.9 14-17.9 18-21.9 22-25.9 26-29.9 30-33.9 (Round to four decimal places as needed.)
Step by Step Solution
There are 3 Steps involved in it

Get step-by-step solutions from verified subject matter experts