

Question: answer the entire question please ( all ratios ) P7.17 (similar to Question Helov Usted here are the 2015 and 2016 balance shots and income
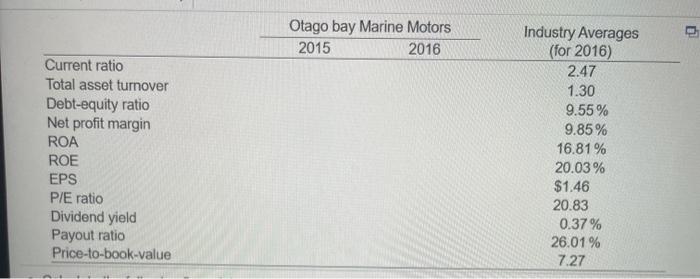
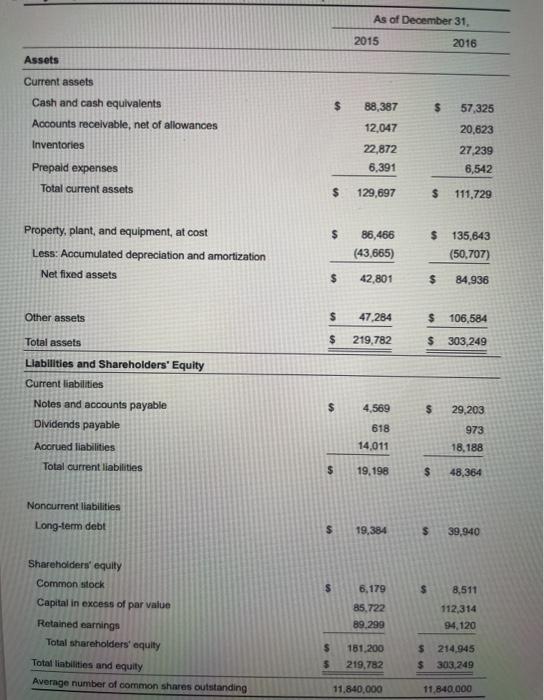
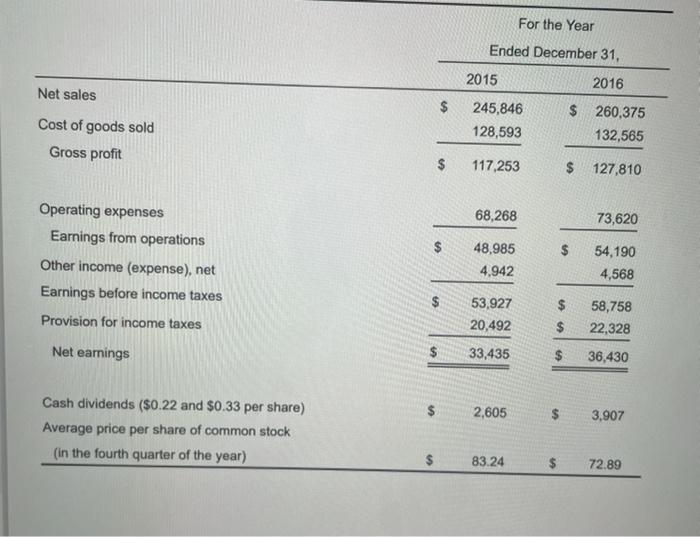
P7.17 (similar to Question Helov Usted here are the 2015 and 2016 balance shots and income statements for Otago Bay Marine Motors, a major manufacturer of top of the line outboard motors. (Click on the confolowing each hyperlink in order to copy its contents into a spreadshot) a. On the basis of the information provided, calculato the following financial tatios for 2015 and 2016. (Click on the icon tocated on the top right comer of the data table below in order to copy its contents into a spreadsheet) Otago bay Marine Motors 2015 2016 U Current ratio Total asset turnover Debt-equity ratio Net profit margin ROA ROE EPS P/E ratio Dividend yield Payout ratio Price-to-book-value Industry Averages (for 2016) 2.47 1.30 9.55% 9.85% 16.81% 20.03% $1.46 20.83 0.37% 26.01% 7.27 As of December 31, 2015 2016 Assets Current assets $ 88,387 $ Cash and cash equivalents Accounts receivable, net of allowances 57,325 20.623 Inventories 12,047 22,872 6.391 27,239 6,542 Prepaid expenses Total current assets $ 129,697 $ 111,729 $ Property, plant, and equipment, at cost Less: Accumulated depreciation and amortization Net fixed assets 86,466 (43,665) $ 135,643 (50,707) $ 42.801 $ 84,936 Other assets $ 47,284 $ 106,584 $ 219,782 $ 303,249 Total assets Llabilities and Shareholders' Equity Current liabilities Notes and accounts payable Dividends payable $ 4,569 $ 29,203 618 973 18,188 Accrued liabilities 14,011 Total current liabilities $ 19,198 $ 48,364 Noncurrent liabilities Long-term debt $ 19,384 $ 39,940 Shareholders' equity Common stock $ 6,179 $ Capital in excess of par value 85.722 89.299 8,511 112,314 94.120 $ Retained earnings Total shareholders' equity Total liabilities and equity Average number of common shares outstanding $ 5 181,200 219,782 214,945 303,249 $ 11.840.000 11,840,000 For the Year Ended December 31, 2015 2016 Net sales $ Cost of goods sold Gross profit 245,846 128,593 $ 260,375 132,565 $ 117,253 $ 127,810 68,268 73,620 $ $ Operating expenses Earnings from operations Other income (expense), net Earnings before income taxes Provision for income taxes 48,985 4.942 54,190 4,568 $ 53,927 20,492 58,758 22,328 Net earnings $ 33,435 $ 36,430 2,605 3,907 Cash dividends ($0.22 and $0.33 per share) Average price per share of common stock (in the fourth quarter of the year) $ 83.24 $ 72.89
Step by Step Solution
There are 3 Steps involved in it

Get step-by-step solutions from verified subject matter experts