

Question: - Answer the Explore questions, andfor provide a description of what happens in the applet after following each step. - As you 'play' with the

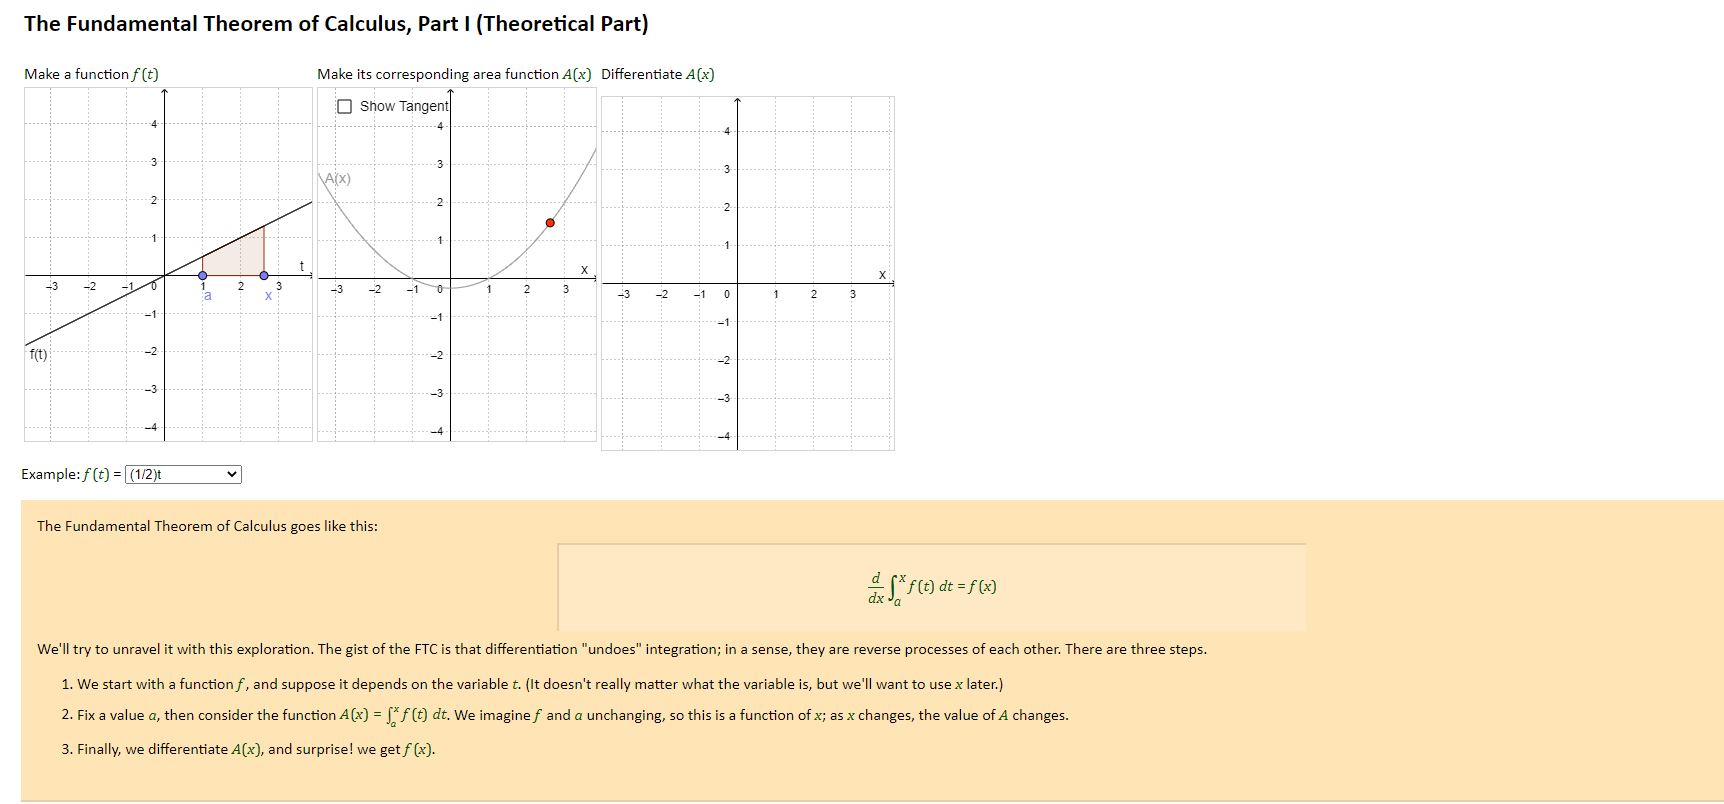
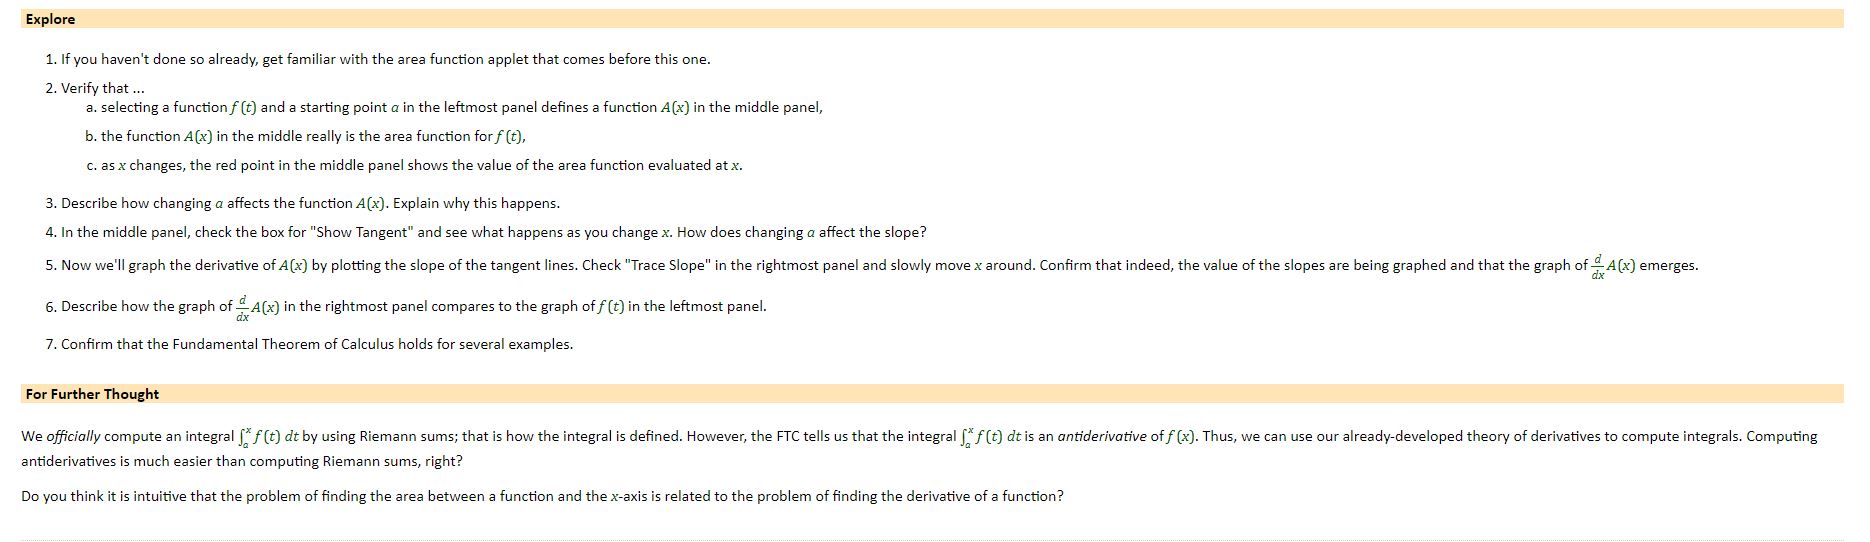
- Answer the Explore questions, andfor provide a description of what happens in the applet after following each step. - As you 'play' with the applets describe what happens as you change one of the endpoints at a time. Then describe what happens as you change the function, and then change the endpoints. Write down notes as you change these values, possibly making a table of different values (x. x), x). Fm, etc.) and making a guess (conjecture) as to relationships between quanties. After doing this for a few functions, what do you wonder? Try to either conrm or provide a counterexample by changing the tunction and testing your conjecture. - Go through each function, set a = O, and change the value of b. Record what happens to each of the various results as you change b. Then, looking across your notes for the various functions, what things doyou notice? What do you wonder? \fExplore 1. If you haven't done so already, get familiar with the area function applet that comes before this one. 2. Verify that ... . selecting a function f (t) and a starting point a in the leftmost panel defines a function A(x) in the middle panel, b. the function A(x) in the middle really is the area function for f (t), c. as x changes, the red point in the middle panel shows the value of the area function evaluated at x. 3. Describe how changing a affects the function A(x). Explain why this happens. 4. In the middle panel, check the box for "Show Tangent" and see what happens as you change x. How does changing a affect the slope? 5. Now we'll graph the derivative of A(x) by plotting the slope of the tangent lines. Check "Trace Slope" in the rightmost panel and slowly move x around. Confirm that indeed, the value of the slopes are being graphed and that the graph of A(x) emerges. 6. Describe how the graph of A(x) in the rightmost panel compares to the graph of f (t) in the leftmost panel. 7. Confirm that the Fundamental Theorem of Calculus holds for several examples. For Further Thought We officially compute an integral [ f (t) dt by using Riemann sums; that is how the integral is defined. However, the FTC tells us that the integral [ f (t) dt is an antiderivative of f (*). Thus, we can use our already-developed theory of derivatives to compute integrals. Computing antiderivatives is much easier than computing Riemann sums, right? Do you think it is intuitive that the problem of finding the area between a function and the x-axis is related to the problem of finding the derivative of a function
Step by Step Solution
There are 3 Steps involved in it

Get step-by-step solutions from verified subject matter experts