

Question: answer the following 1. Plot the graph of the demand and supply schedule below, determine the equilibrium quantity and equilibrium price, and label each curve.
answer the following

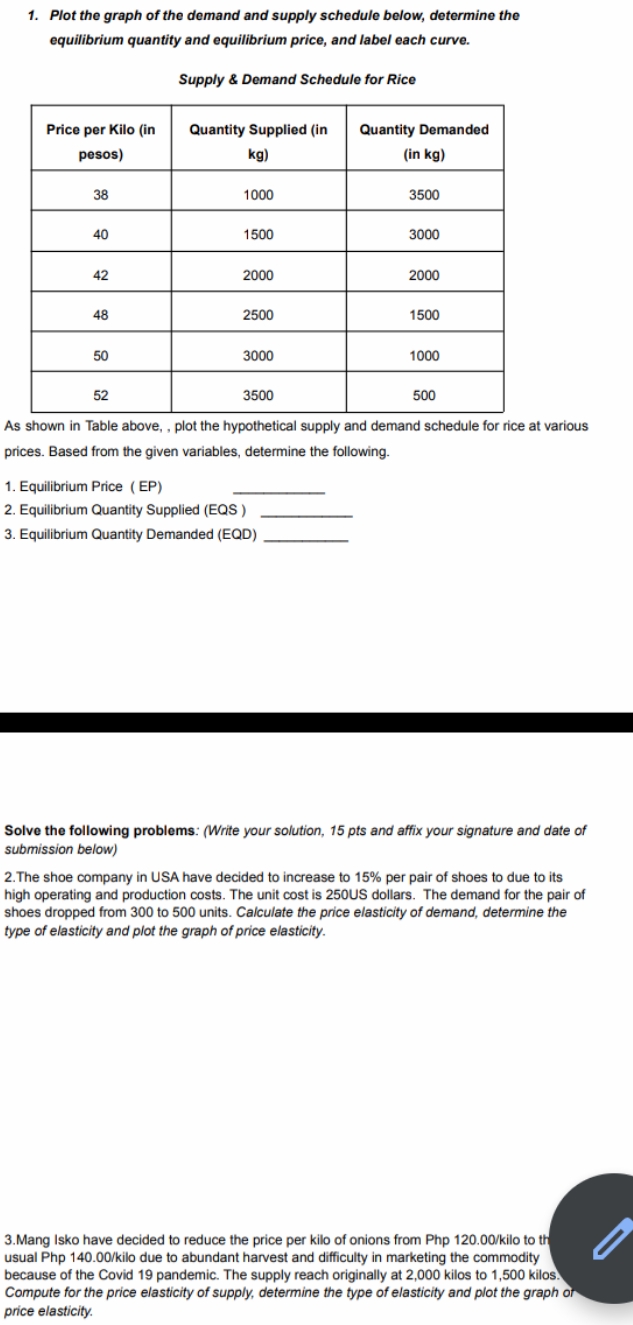
1. Plot the graph of the demand and supply schedule below, determine the equilibrium quantity and equilibrium price, and label each curve. Supply & Demand Schedule for Rice Price per Kilo (in Quantity Supplied (in Quantity Demanded pesos) kg) (in kg) 38 1000 3500 40 1500 3000 42 2000 2000 48 2500 1500 50 3000 1000 52 3500 500 As shown in Table above, , plot the hypothetical supply and demand schedule for rice at various prices. Based from the given variables, determine the following. 1. Equilibrium Price ( EP) 2. Equilibrium Quantity Supplied (EQS ) 3. Equilibrium Quantity Demanded (EQD) Solve the following problems: (Write your solution, 15 pts and affix your signature and date of submission below) 2. The shoe company in USA have decided to increase to 15% per pair of shoes to due to its high operating and production costs. The unit cost is 250US dollars. The demand for the pair of shoes dropped from 300 to 500 units. Calculate the price elasticity of demand, determine the type of elasticity and plot the graph of price elasticity. 3.Mang Isko have decided to reduce the price per kilo of onions from Php 120.00/kilo to the usual Php 140.00/kilo due to abundant harvest and difficulty in marketing the commodity because of the Covid 19 pandemic. The supply reach originally at 2,000 kilos to 1,500 kilos. Compute for the price elasticity of supply, determine the type of elasticity and plot the graph of price elasticity
Step by Step Solution
There are 3 Steps involved in it

Get step-by-step solutions from verified subject matter experts