

Question: Answer the following question for either Intel, McDonalds or Amazon OR for your selected focus company: a. Using the most updated Annual Reports, calculate key
Answer the following question for either Intel, McDonalds or Amazon OR for your selected focus company:
a. Using the most updated Annual Reports, calculate key financial ratios for all years presented. CURRENT RATIO=Current Asset/Current Liability
QUICK RATIO= (Current Asset-Inventories)/Current Liability
WORKING CAPITAL=Current Asset-Current Liability
DEBT / EQUITY RATION=Total Liabilities/Shareholders Equity
b. Using the library, find industry averages to compare to the calculations in a. c. Write a SHORT report evaluating of short-term liquidity, operating efficiency, capital structure and long term solvency, profitability, market measures, and a discussion of any quality of financial reporting issues.
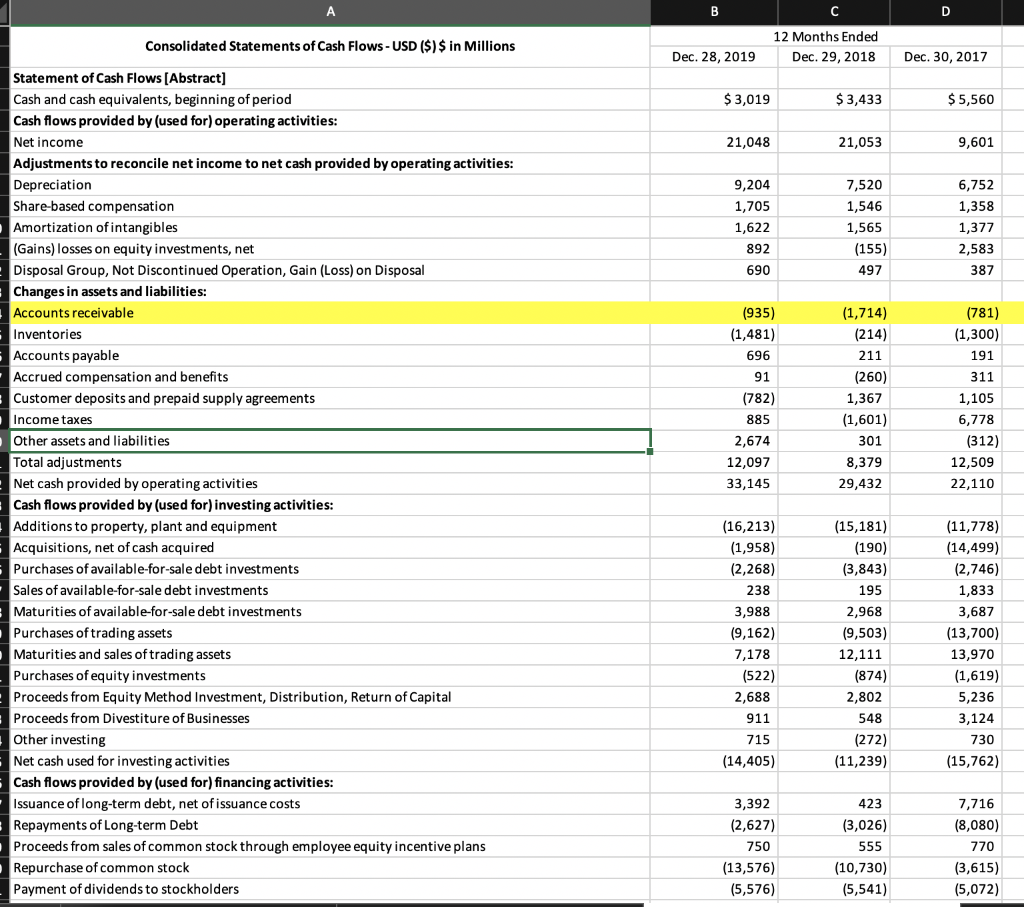
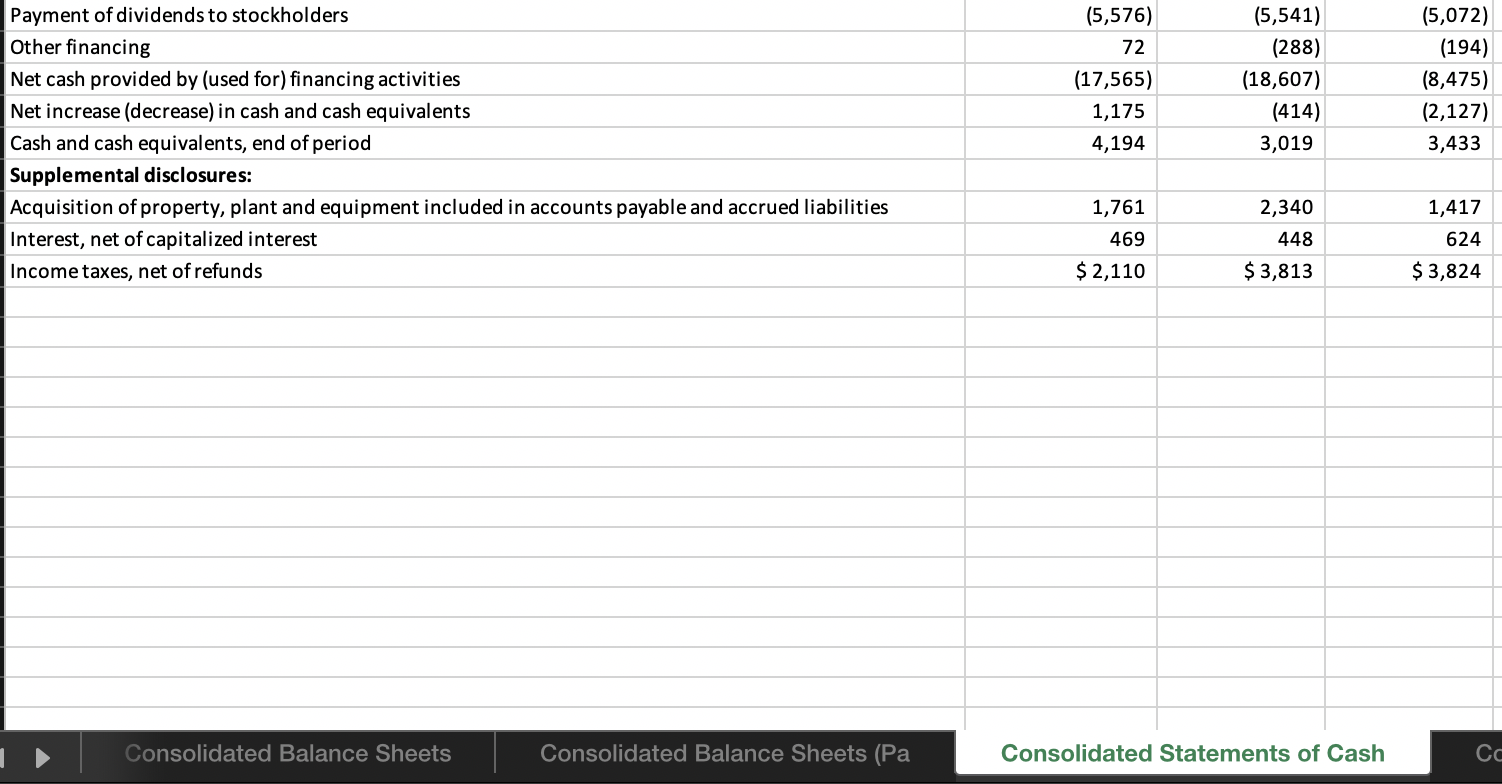
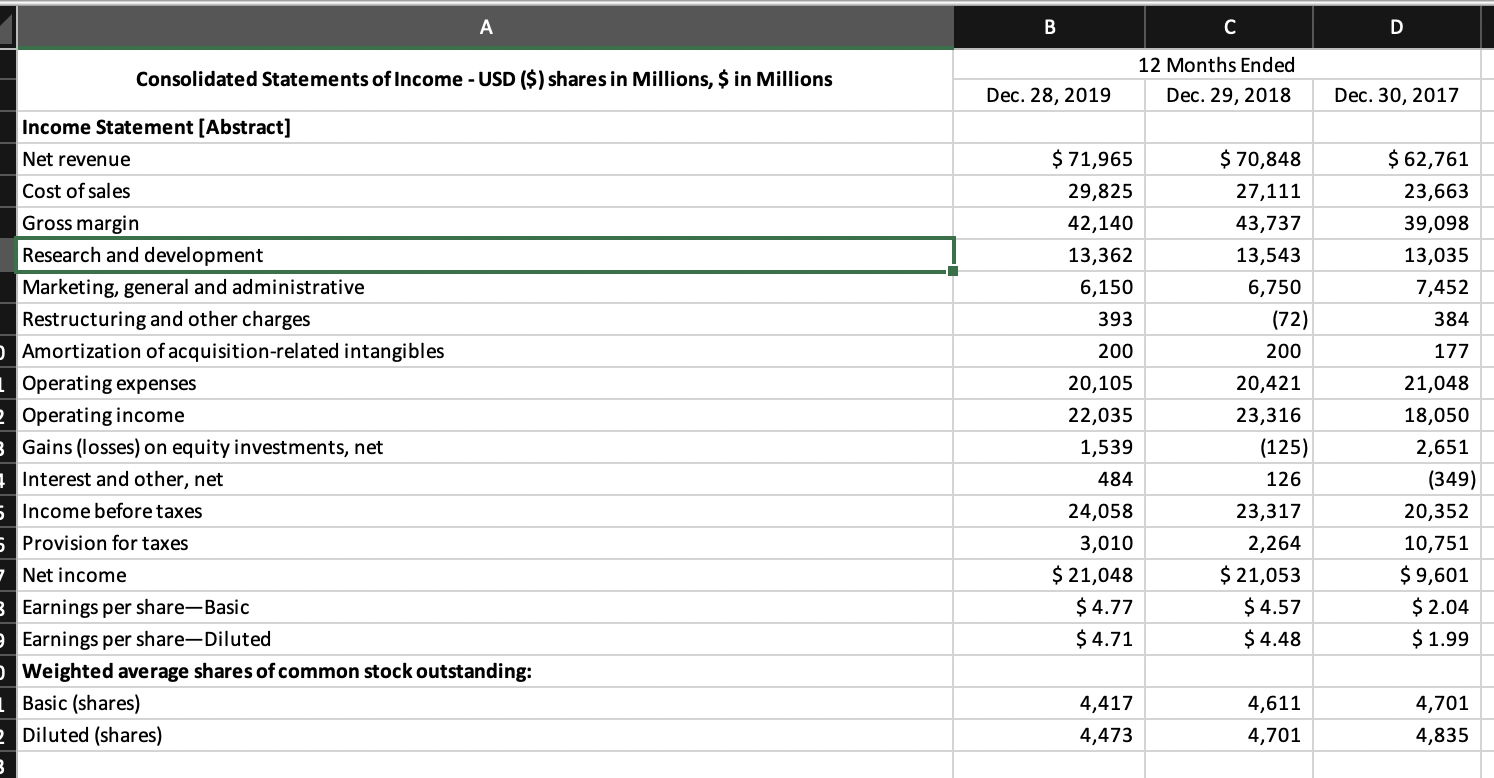
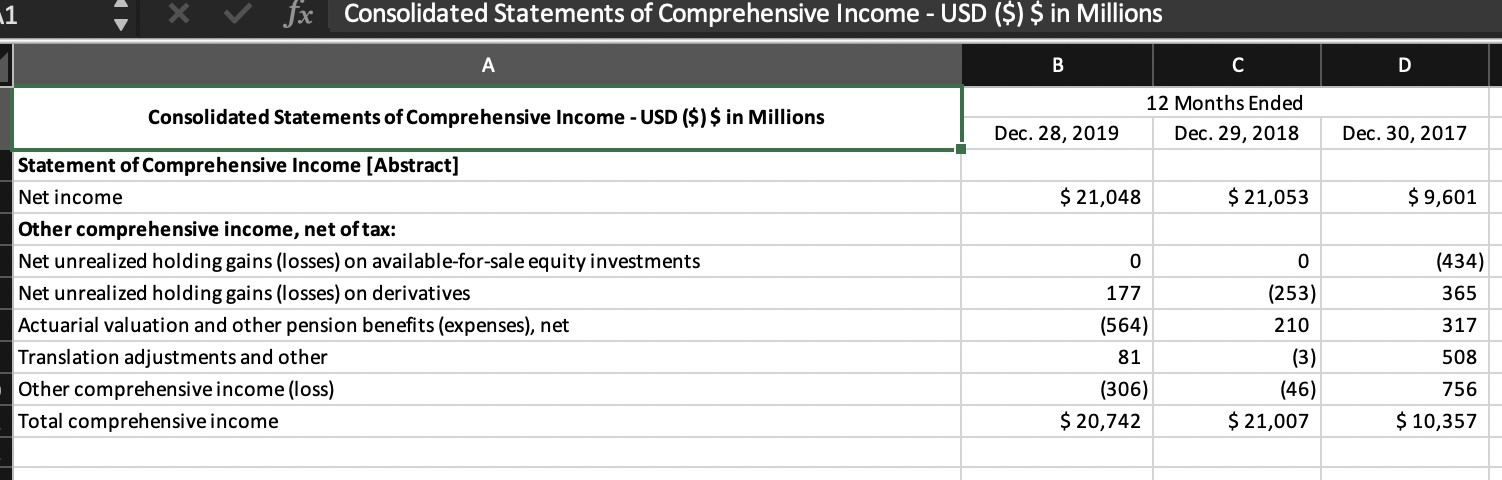
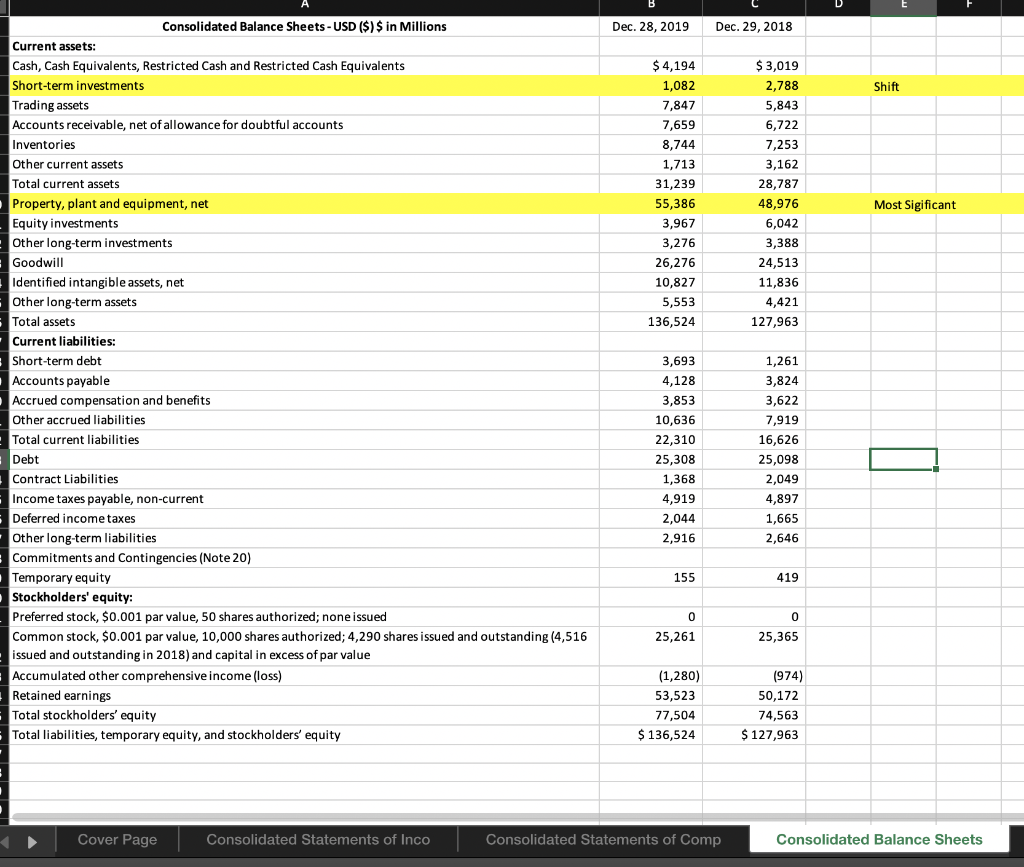
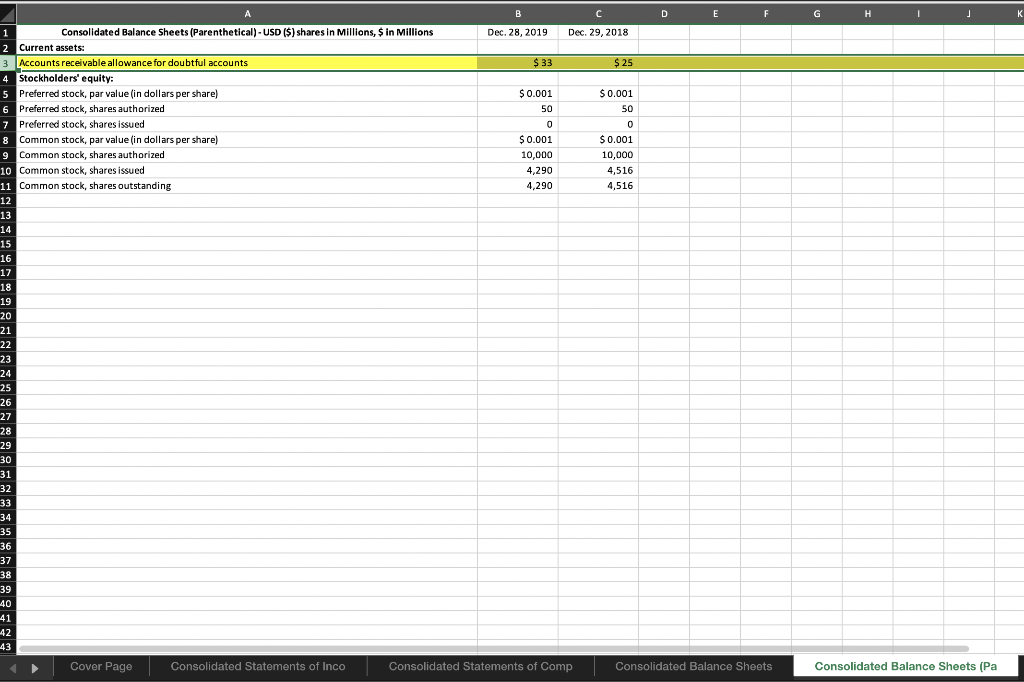
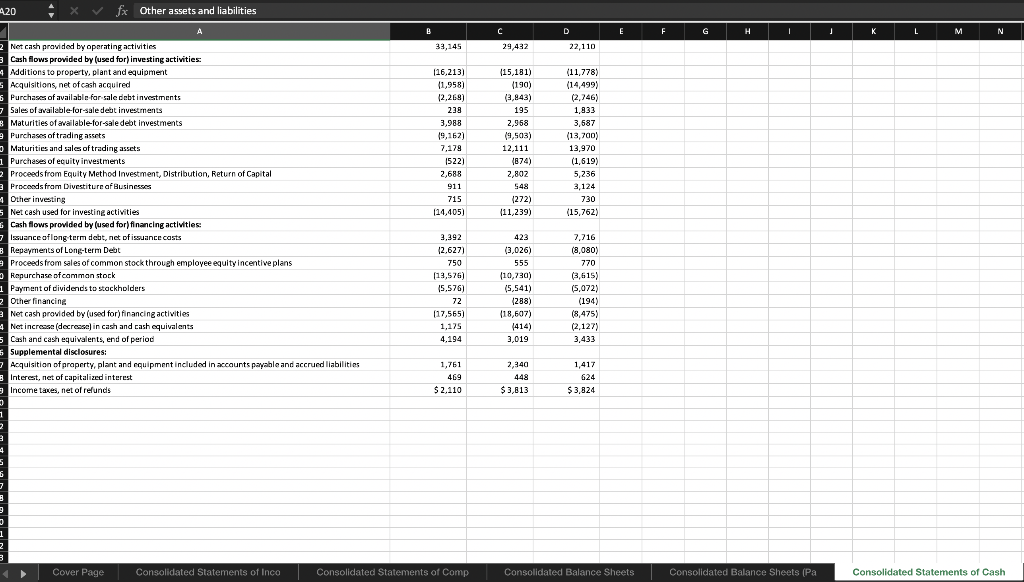
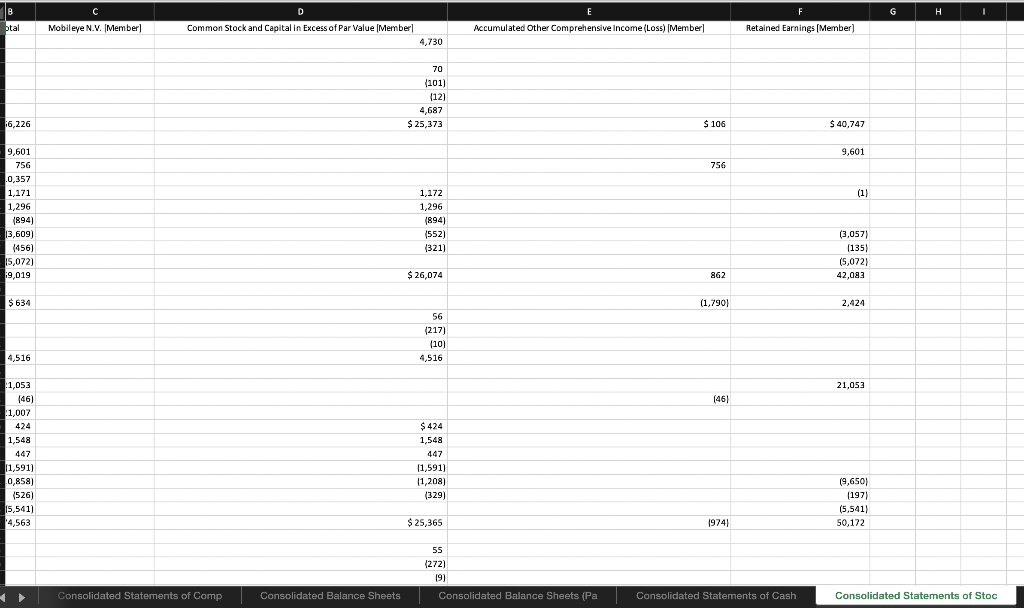
B C D Consolidated Statements of Cash Flows - USD ($) $ in Millions 12 Months Ended Dec. 29, 2018 Dec. 28, 2019 Dec. 30, 2017 $ 3,019 $3,433 $5,560 21,048 21,053 9,601 9,204 1,705 1,622 892 690 7,520 1,546 1,565 (155) 497 6,752 1,358 1,377 2,583 387 (935) (1,481) 696 Statement of Cash Flows (Abstract] Cash and cash equivalents, beginning of period Cash flows provided by (used for) operating activities: Net income Adjustments to reconcile net income to net cash provided by operating activities: Depreciation Share-based compensation Amortization of intangibles (Gains) losses on equity investments, net Disposal Group, Not Discontinued Operation, Gain (Loss) on Disposal Changes in assets and liabilities: Accounts receivable Inventories Accounts payable Accrued compensation and benefits Customer deposits and prepaid supply agreements Income taxes Other assets and liabilities Total adjustments Net cash provided by operating activities Cash flows provided by (used for) investing activities: Additions to property, plant and equipment Acquisitions, net of cash acquired Purchases of available-for-sale debt investments Sales of available-for-sale debt investments Maturities of available-for-sale debt investments Purchases of trading assets Maturities and sales of trading assets Purchases of equity investments Proceeds from Equity Method Investment, Distribution, Return of Capital Proceeds from Divestiture of Businesses Other investing Net cash used for investing activities Cash flows provided by (used for) financing activities: Issuance of long-term debt, net of issuance costs Repayments of Long-term Debt Proceeds from sales of common stock through employee equity incentive plans Repurchase of common stock Payment of dividends to stockholders 91 (782) 885 2,674 12,097 33,145 (1,714) (214) 211 (260) 1,367 (1,601) 301 8,379 29,432 (781) (1,300) 191 311 1,105 6,778 (312) 12,509 22,110 (16,213) (1,958) (2,268) 238 3,988 (9,162) 7,178 (522) 2,688 911 715 (14,405) (15,181) (190) (3,843) 195 2,968 (9,503) 12.111 (874) 2,802 548 (272) (11,239) (11,778) (14,499) (2,746) 1,833 3,687 (13,700) 13,970 (1,619) 5,236 3,124 730 (15,762) 3,392 (2,627) 750 (13,576) (5,576) 423 (3,026) 555 (10,730) (5,541) 7,716 (8,080) 770 (3,615) (5,072) Payment of dividends to stockholders Other financing Net cash provided by (used for) financing activities Net increase (decrease) in cash and cash equivalents Cash and cash equivalents, end of period Supplemental disclosures: Acquisition of property, plant and equipment included in accounts payable and accrued liabilities Interest, net of capitalized interest Income taxes, net of refunds (5,576) 72 (17,565) 1,175 4,194 (5,541) (288) (18,607) (414) 3,019 (5,072) (194) (8,475) (2,127) 3,433 1,761 469 $ 2,110 2,340 448 $ 3,813 1,417 624 $ 3,824 Consolidated Balance Sheets Consolidated Balance Sheets (Pa Consolidated Statements of Cash Cc A B C D Consolidated Statements of Income - USD ($) shares in Millions, $ in Millions 12 Months Ended Dec. 29, 2018 Dec. 28, 2019 Dec. 30, 2017 $ 71,965 29,825 42,140 13,362 6,150 393 200 Income Statement(Abstract] Net revenue Cost of sales Gross margin Research and development Marketing, general and administrative Restructuring and other charges Amortization of acquisition-related intangibles 1 Operating expenses - Operating income Gains (losses) on equity investments, net 1 Interest and other, net Income before taxes 5 Provision for taxes Net income 3 Earnings per share-Basic Earnings per share-Diluted Weighted average shares of common stock outstanding: Basic (shares) 2 Diluted (shares) 20,105 22,035 1,539 484 24,058 3,010 $ 21,048 $ 4.77 $ 4.71 $ 70,848 27,111 43,737 13,543 6,750 (72) 200 20,421 23,316 (125) 126 23,317 2,264 $ 21,053 $ 4.57 $ 4.48 $62,761 23,663 39,098 13,035 7,452 384 177 21,048 18,050 2,651 (349) 20,352 10,751 $ 9,601 $2.04 $ 1.99 4,417 4,473 4,611 4,701 4,701 4,835 3 1 fx Consolidated Statements of Comprehensive Income - USD ($) $ in Millions A B Consolidated Statements of Comprehensive Income - USD ($) $ in Millions 12 Months Ended Dec. 29, 2018 Dec. 28, 2019 Dec. 30, 2017 $ 21,048 $ 21,053 $ 9,601 0 0 Statement of Comprehensive Income (Abstract] Net income Other comprehensive income, net of tax: Net unrealized holding gains (losses) on available-for-sale equity investments Net unrealized holding gains (losses) on derivatives Actuarial valuation and other pension benefits (expenses), net Translation adjustments and other Other comprehensive income (loss) Total comprehensive income 177 (434) 365 317 (253) 210 (3) (46) $ 21,007 (564) 81 (306) $ 20,742 508 756 $ 10,357 B Dec. 28, 2019 Dec. 29, 2018 Shift $ 3,019 2,788 5,843 6,722 7,253 $ 4,194 1,082 7,847 7,659 8,744 1,713 31,239 55,386 3,967 3,276 26,276 10,827 5,553 136,524 Most Sigificant 3,162 28,787 48,976 6,042 3,388 24,513 11,836 4,421 127,963 Consolidated Balance Sheets - USD ($) $ in Millions Current assets: Cash, Cash Equivalents, Restricted Cash and Restricted Cash Equivalents Short-term investments Trading assets Accounts receivable, net of allowance for doubtful accounts Inventories Other current assets Total current assets Property, plant and equipment, net Equity investments Other long-term investments Goodwill Identified intangible assets, net Other long-term assets Total assets Current liabilities: Short-term debt Accounts payable Accrued compensation and benefits Other accrued liabilities Total current liabilities Debt Contract Liabilities Income taxes payable, non-current Deferred income taxes Other long-term liabilities Commitments and Contingencies (Note 20) Temporary equity Stockholders' equity: Preferred stock, $0.001 par value, 50 shares authorized; none issued Common stock, $0.001 par value, 10,000 shares authorized; 4,290 shares issued and outstanding (4,516 issued and outstanding in 2018) and capital in excess of par value Accumulated other comprehensive income (loss) Retained earnings Total stockholders' equity Total liabilities, temporary equity, and stockholders' equity 3,693 4,128 3,853 10,636 22,310 25,308 1,368 4,919 2,044 2,916 1,261 3,824 3,622 7,919 16,626 25,098 2,049 4,897 1,665 2,646 O 155 419 0 0 25,261 25,365 (1,280) 53,523 77,504 $ 136,524 (974) 50,172 74,563 $ 127,963
Step by Step Solution
There are 3 Steps involved in it

Get step-by-step solutions from verified subject matter experts