

Question: Answer the following Questions 1. Plot the output frequency versus the input voltage for each deviation sensitivity setting. 2. From the Table 1 results, which
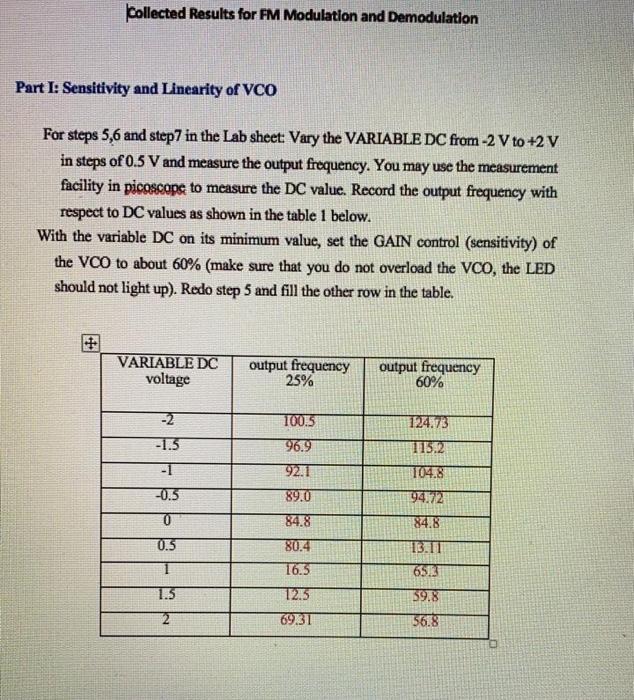
Answer the following Questions 1. Plot the output frequency versus the input voltage for each deviation sensitivity setting. 2. From the Table 1 results, which setting of deviation sensitivity results in a more linear performance in the given range DC input signal (Vin). 3. Determine the linear range for deviation sensitivity of 60%. 4. Using the table 1 results, estimate the frequency of the VCO when the DC input is at 1.25 V, 1.75 V and -1.25 V for both deviation sensitivity settings. Which deviation sensitivity setting results in easier interpolation? Discuss why? 5. From the results of Part II, explain the effect of changing the frequency of audio oscillator and VCO gain in the modulated and spectrum of FM signal. 6. At the maximum and minimum of input signal frequency and VCO gain, explain the obtained spectra of Part II in light of Carson's Rule for bandwidth estimation. What is the bandwidth of the modulated signal at the maximum and minimum setting. 7. Compare the waveform and frequency of the message at the transmitter, and the message from the demodulator. Collected Results for FM Modulation and Demodulation Part I: Sensitivity and Linearity of VCO For steps 5,6 and step7 in the Lab sheet: Vary the VARIABLE DC from -2 V to +2 V in steps of 0.5 V and measure the output frequency. You may use the measurement facility in picoscope to measure the DC value. Record the output frequency with respect to DC values as shown in the table 1 below. With the variable DC on its minimum value, set the GAIN control (sensitivity) of the VCO to about 60% (make sure that you do not overload the VCO, the LED should not light up). Redo step 5 and fill the other row in the table. VARIABLE DC voltage output frequency 25% output frequency 60% -2 100.5 124573 115.2 -1.5 96.9 92.1 104.8 89.0 94.72 -0.5 0 84.8 84.8 0.5 80.4 16.5 13.TT 653 59.8 56.8 1.5 12.5 2 69.31 Answer the following Questions 1. Plot the output frequency versus the input voltage for each deviation sensitivity setting. 2. From the Table 1 results, which setting of deviation sensitivity results in a more linear performance in the given range DC input signal (Vin). 3. Determine the linear range for deviation sensitivity of 60%. 4. Using the table 1 results, estimate the frequency of the VCO when the DC input is at 1.25 V, 1.75 V and -1.25 V for both deviation sensitivity settings. Which deviation sensitivity setting results in easier interpolation? Discuss why? 5. From the results of Part II, explain the effect of changing the frequency of audio oscillator and VCO gain in the modulated and spectrum of FM signal. 6. At the maximum and minimum of input signal frequency and VCO gain, explain the obtained spectra of Part II in light of Carson's Rule for bandwidth estimation. What is the bandwidth of the modulated signal at the maximum and minimum setting. 7. Compare the waveform and frequency of the message at the transmitter, and the message from the demodulator. Collected Results for FM Modulation and Demodulation Part I: Sensitivity and Linearity of VCO For steps 5,6 and step7 in the Lab sheet: Vary the VARIABLE DC from -2 V to +2 V in steps of 0.5 V and measure the output frequency. You may use the measurement facility in picoscope to measure the DC value. Record the output frequency with respect to DC values as shown in the table 1 below. With the variable DC on its minimum value, set the GAIN control (sensitivity) of the VCO to about 60% (make sure that you do not overload the VCO, the LED should not light up). Redo step 5 and fill the other row in the table. VARIABLE DC voltage output frequency 25% output frequency 60% -2 100.5 124573 115.2 -1.5 96.9 92.1 104.8 89.0 94.72 -0.5 0 84.8 84.8 0.5 80.4 16.5 13.TT 653 59.8 56.8 1.5 12.5 2 69.31
Step by Step Solution
There are 3 Steps involved in it

Get step-by-step solutions from verified subject matter experts