

Question: Answer the following questions a. Plot the data points and use the graph to determine whether a linear or quadratic graph would best represent the
Answer the following questions
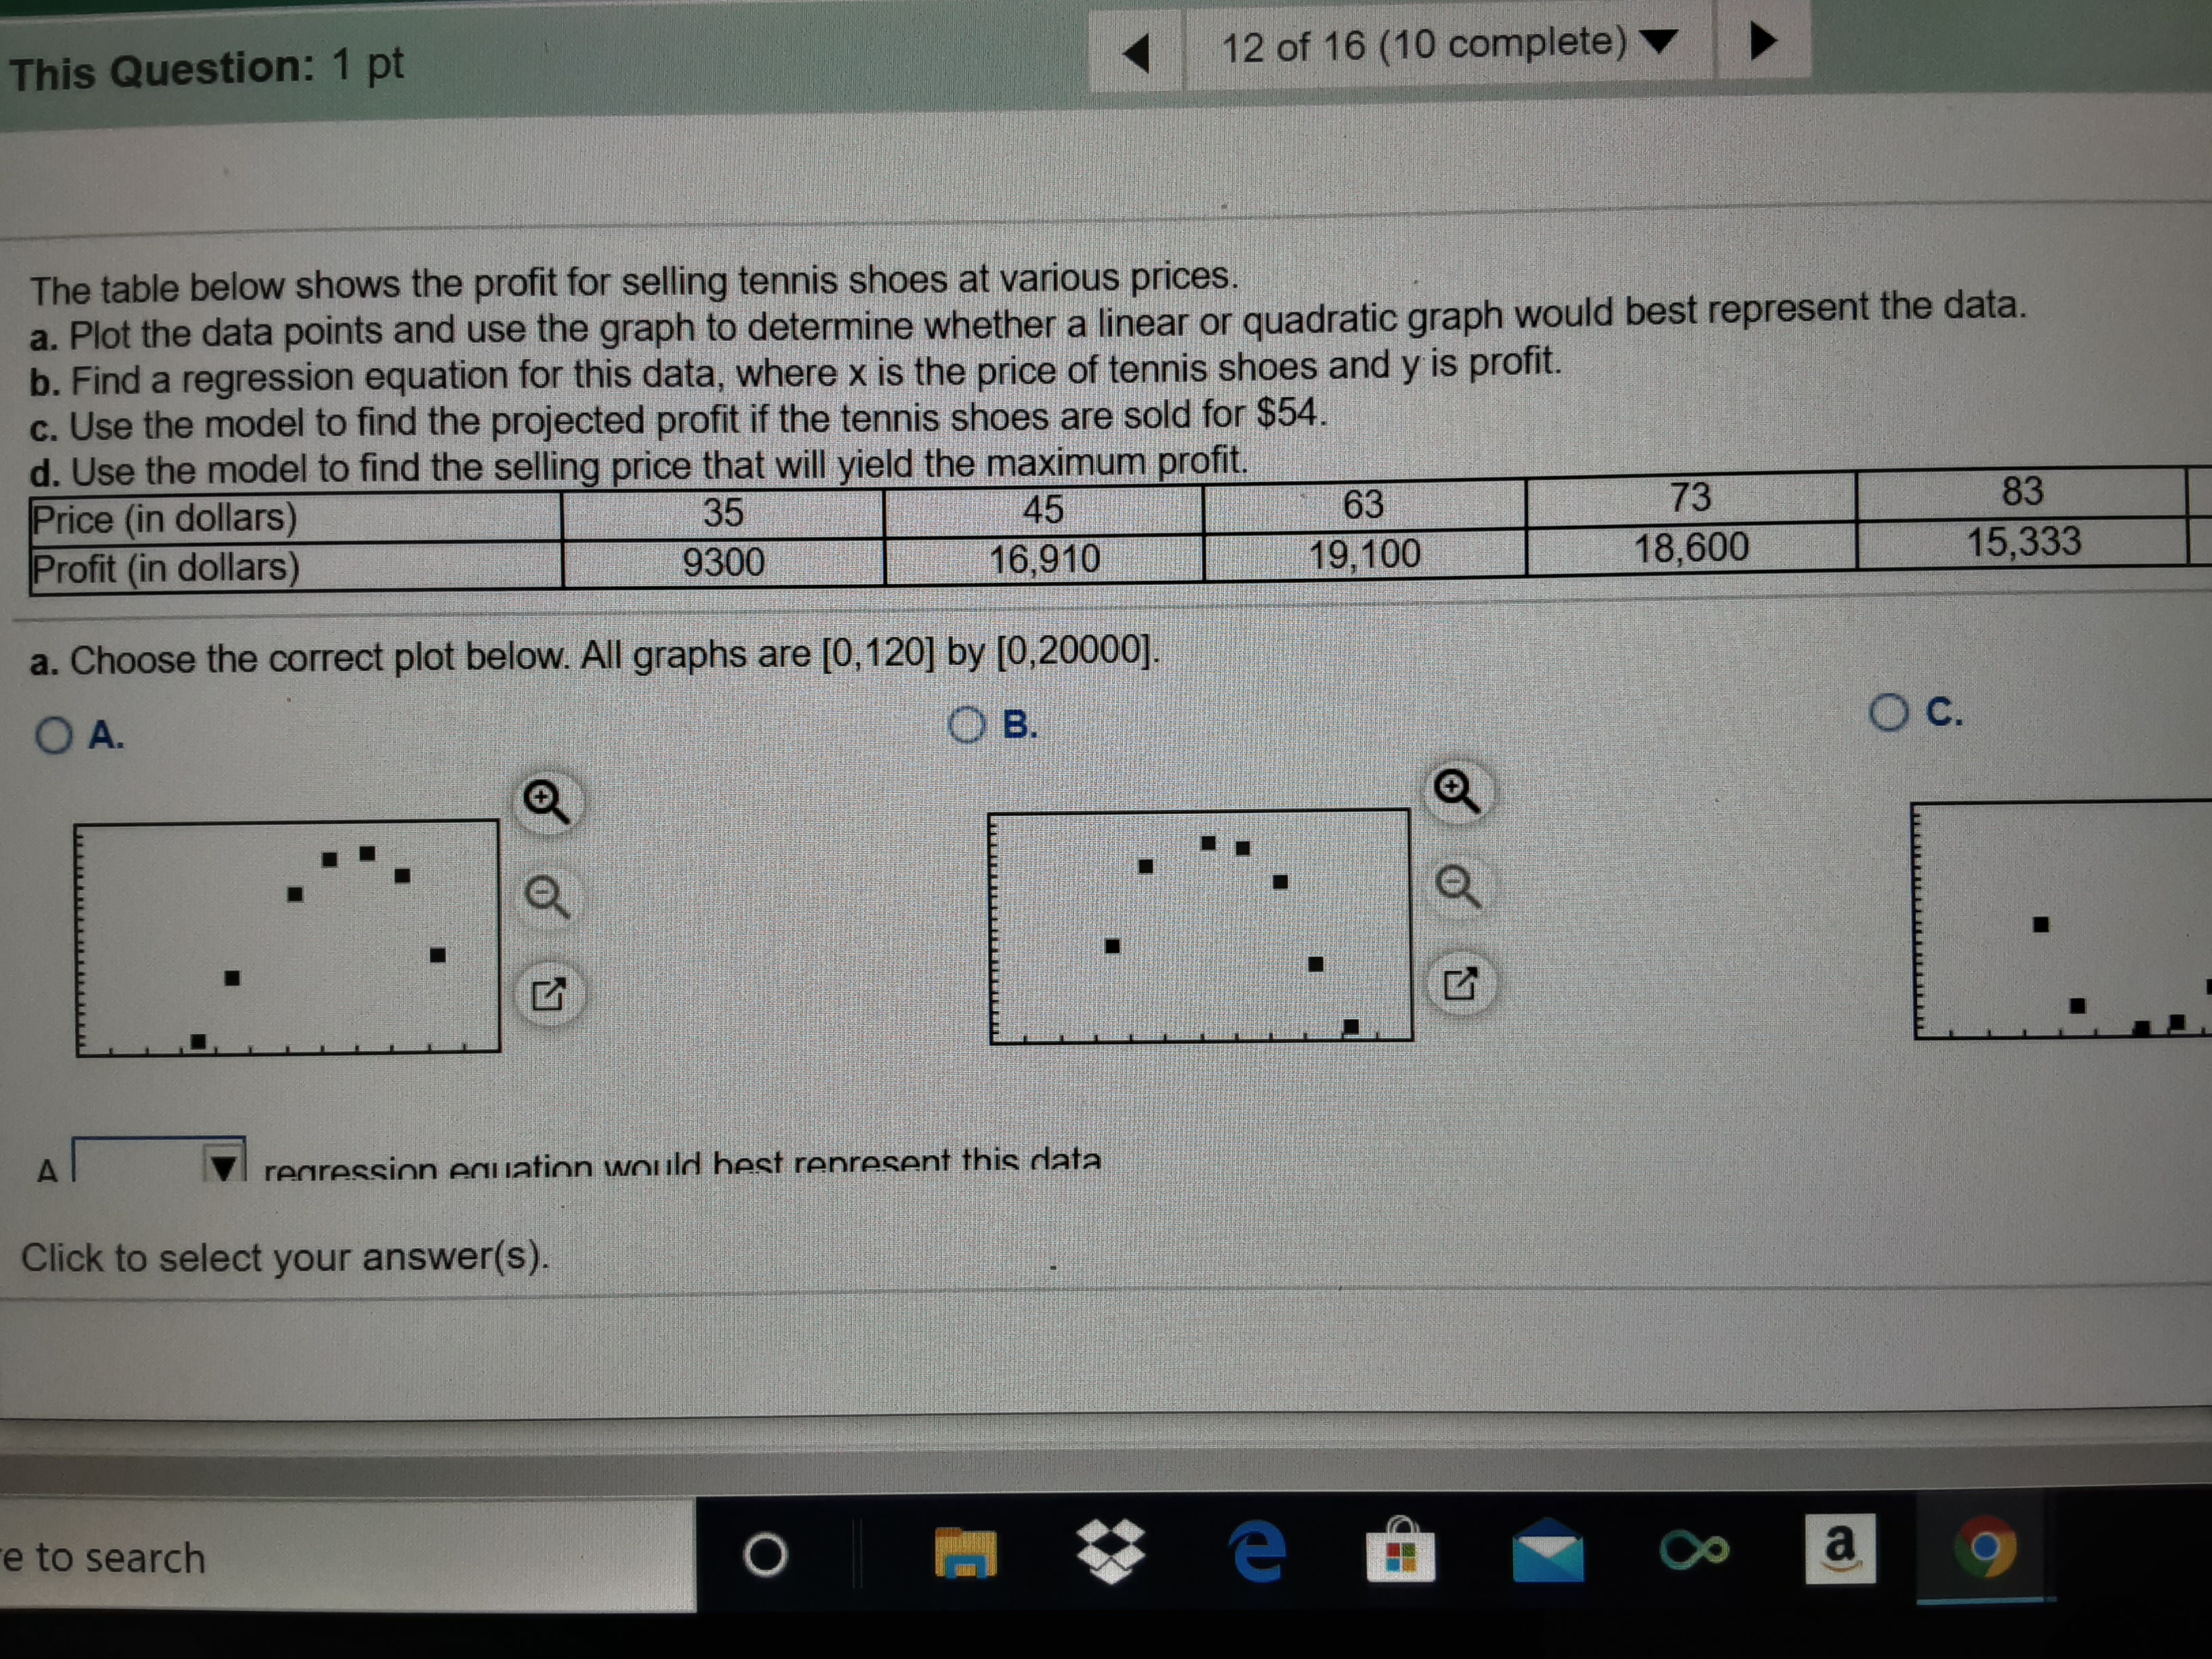
a. Plot the data points and use the graph to determine whether a linear or quadratic graph would best represent the data.
b. Find a regression equation for this?data, where x is the price of tennis shoes and y is profit.
c. Use the model to find the projected profit if the tennis shoes are sold for ?$54.
d. Use the model to find the selling price that will yield the maximum profit.
Step by Step Solution
There are 3 Steps involved in it
1 Expert Approved Answer
Step: 1 Unlock

Question Has Been Solved by an Expert!
Get step-by-step solutions from verified subject matter experts
Step: 2 Unlock
Step: 3 Unlock