

Question: Answer the following questions: Two-Sample Study (tap-only and bottle-only) a. Provide the null and research hypotheses (defining all symbols) for comparing the mean weight gain
Answer the following questions: Two-Sample Study (tap-only and bottle-only)
a. Provide the null and research hypotheses (defining all symbols) for comparing the
mean weight gain in the two water groups.
b. Use a statistical test to determine whether the variances of the two groups (tap-only
and bottle-only) are different.
c. Based on the response to part (b), perform the appropriate two-sample t-test (equal
or unequal variances). Interpret the results.
d. Based on the response to part (b), provide an interval estimate for the mean
difference in weight gain between the two groups. Interpret
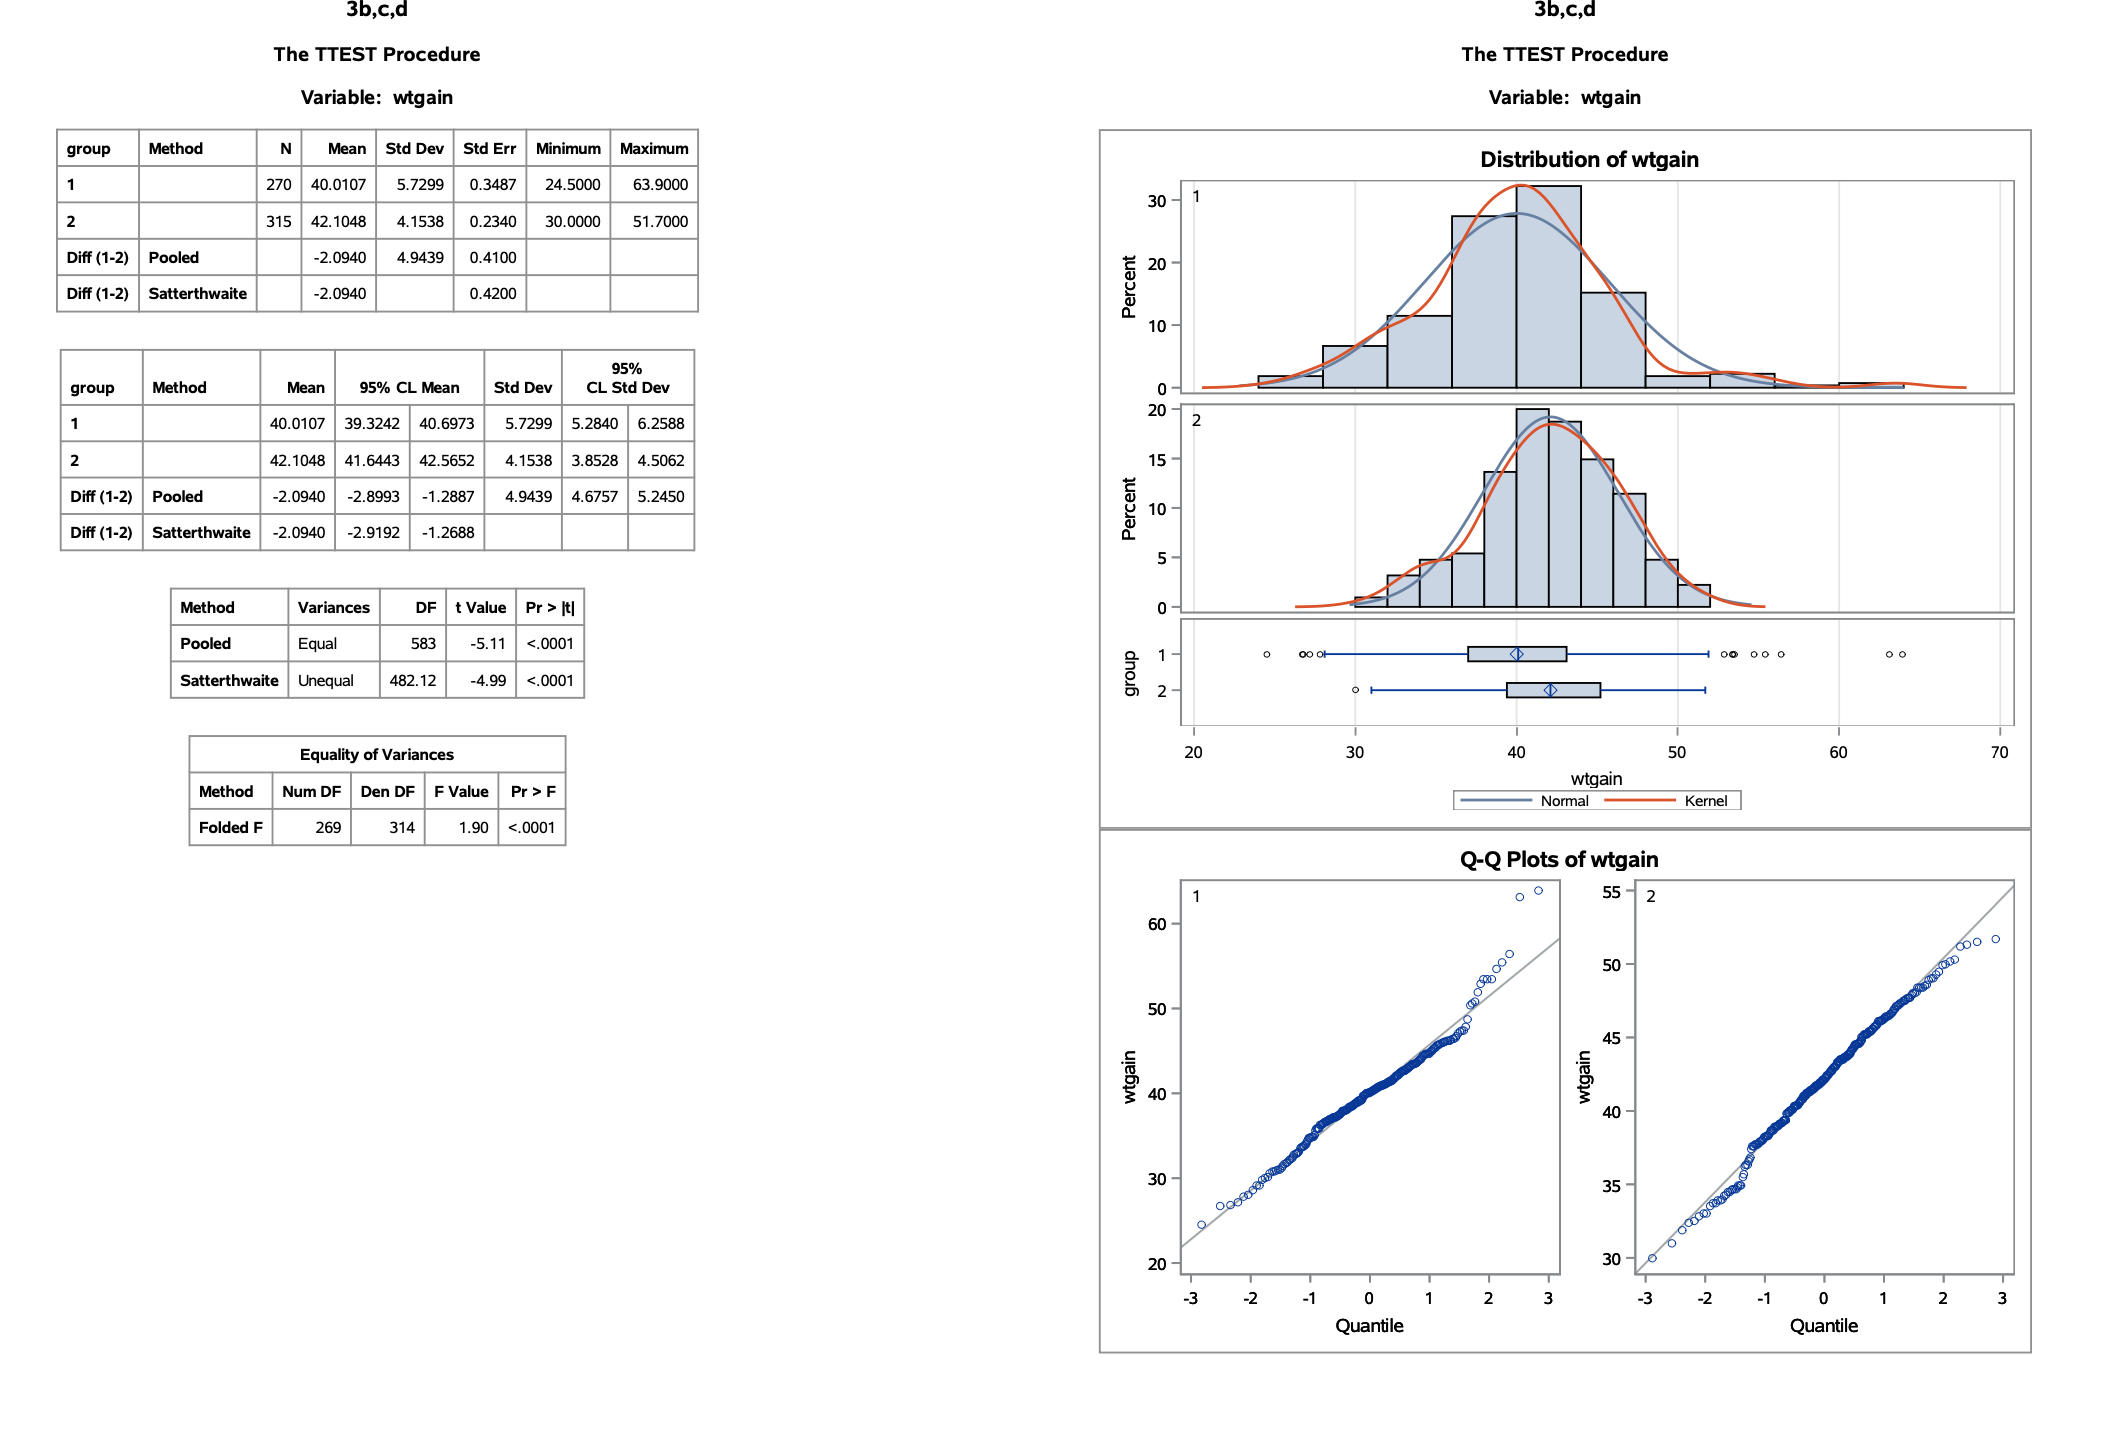
3b,c,d 3b,c,d The TTEST Procedure The TTEST Procedure Variable: wtgain Variable: wtgain group Method N Mean Std Dev Std Err Minimum Maximum Distribution of wtgain 270 40.0107 5.7299 0.3487 24.5000 63.9000 30 - 1 315 42. 1048 4.1538 0.2340 30.0000 51.7000 Diff (1-2) Pooled -2.0940 4.9439 0.4100 20 Percent Diff (1-2) Satterthwaite -2.0940 0.4200 10 95% group Method Mean 95% CL Mean Std Dev CL Std Dev 40.0107 39.3242 40.6973 5.7299 5.2840 6.2588 2 42.1048 41.6443 42.5652 4.1538 3.8528 4.5062 15 Diff (1-2) Pooled -2.0940 -2.8993 -1.2887 4.9439 4.6757 5.2450 Percent Diff (1-2) Satterthwaite -2.0940 -2.9192 -1.2688 Method Variances OF t Value Pr > It| O Pooled Equal 583 -5.11 <.0001 o oo of group satterthwaite unequal .4.99 n equality variances wtgain method num df den f value pr> F Normal - Kernel Folded F 269 314 1.90 <.0001 q-q plots of wtgain quantile>
Step by Step Solution
There are 3 Steps involved in it

Get step-by-step solutions from verified subject matter experts