

Question: Answer the following questions using the data attached to the question. 1. Explain in detail, why the chosen variable is your explanatory variable and response?
Answer the following questions using the data attached to the question.
1. Explain in detail, why the chosen variable is your explanatory variable and response?
2. Calculate the Least Square Regression Line (line of best fit) without using your calculator. Show your work----- using the means and standard deviation of each variable.
3. Predict an individual that is not on your list. Be clear on what value you're predicting and interpret the response variable in context. Show your work.
4. Predict the residual for the 8thcountry on your list. Interpret the residual in context. Show your work.
5. Explain why predicting a data value outside of your collected data results in unconfident predictions?
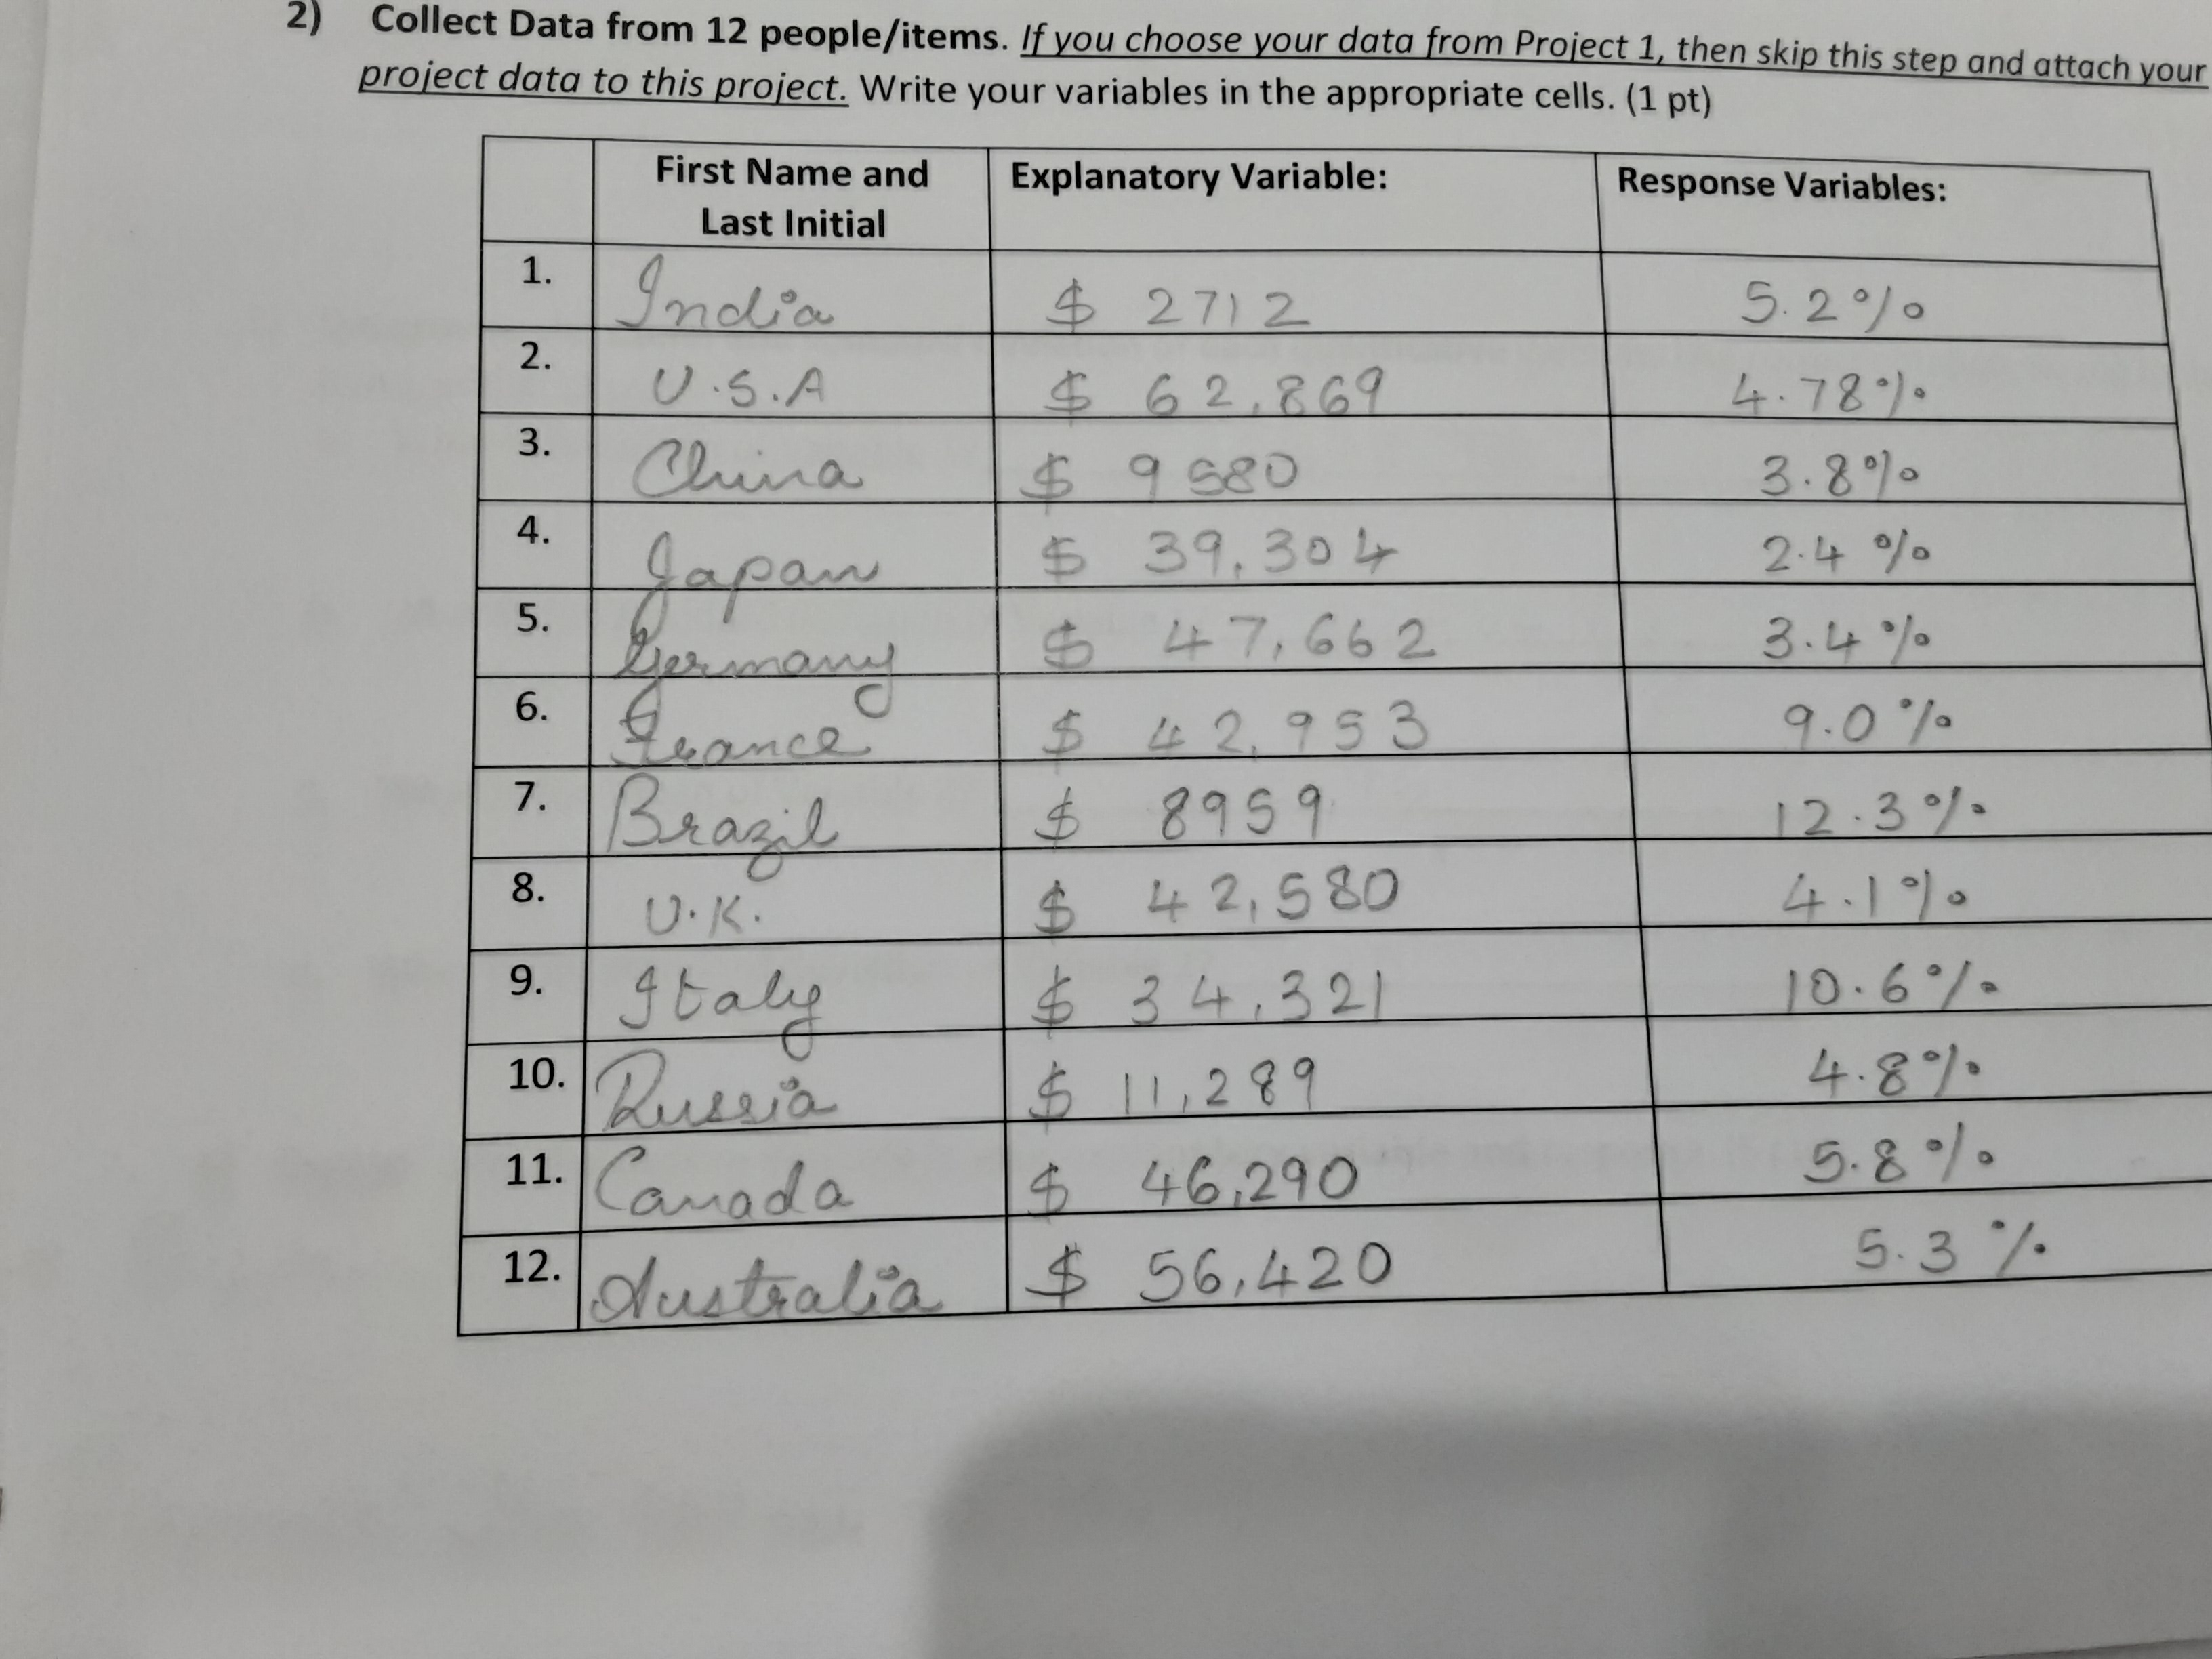

N Collect Data from 12 people/items. If you choose your data from Project 1, then skip this step and attach your project data to this project. Write your variables in the appropriate cells. (1 pt) First Name and Explanatory Variable: Last Initial Response Variables: $ 2712 5.20/0 U. S. A m $ 62, 869 4. 78 0 ) . $ 9580 3. 8 10 Japan $ 39. 30 4 2.4 0/0 6 47, 662 3. 4 0 france 5 4 2, 953 9.0 %% Brasil 8959 12.3 0 . U. K . 4 2 , 580 4. 1 0 0 Italy $ 3 4, 321 10 .6 0/ Russia $ 11,289 4.8 % . Canada $ 46,290 5.8 0%% Australia $ 56, 420 5.3 %\f
Step by Step Solution
There are 3 Steps involved in it

Get step-by-step solutions from verified subject matter experts