

Question: Answer the following questions, using the histogram below showing the Number of TV Hours watched per day.: 1. Estimate the category of the median of
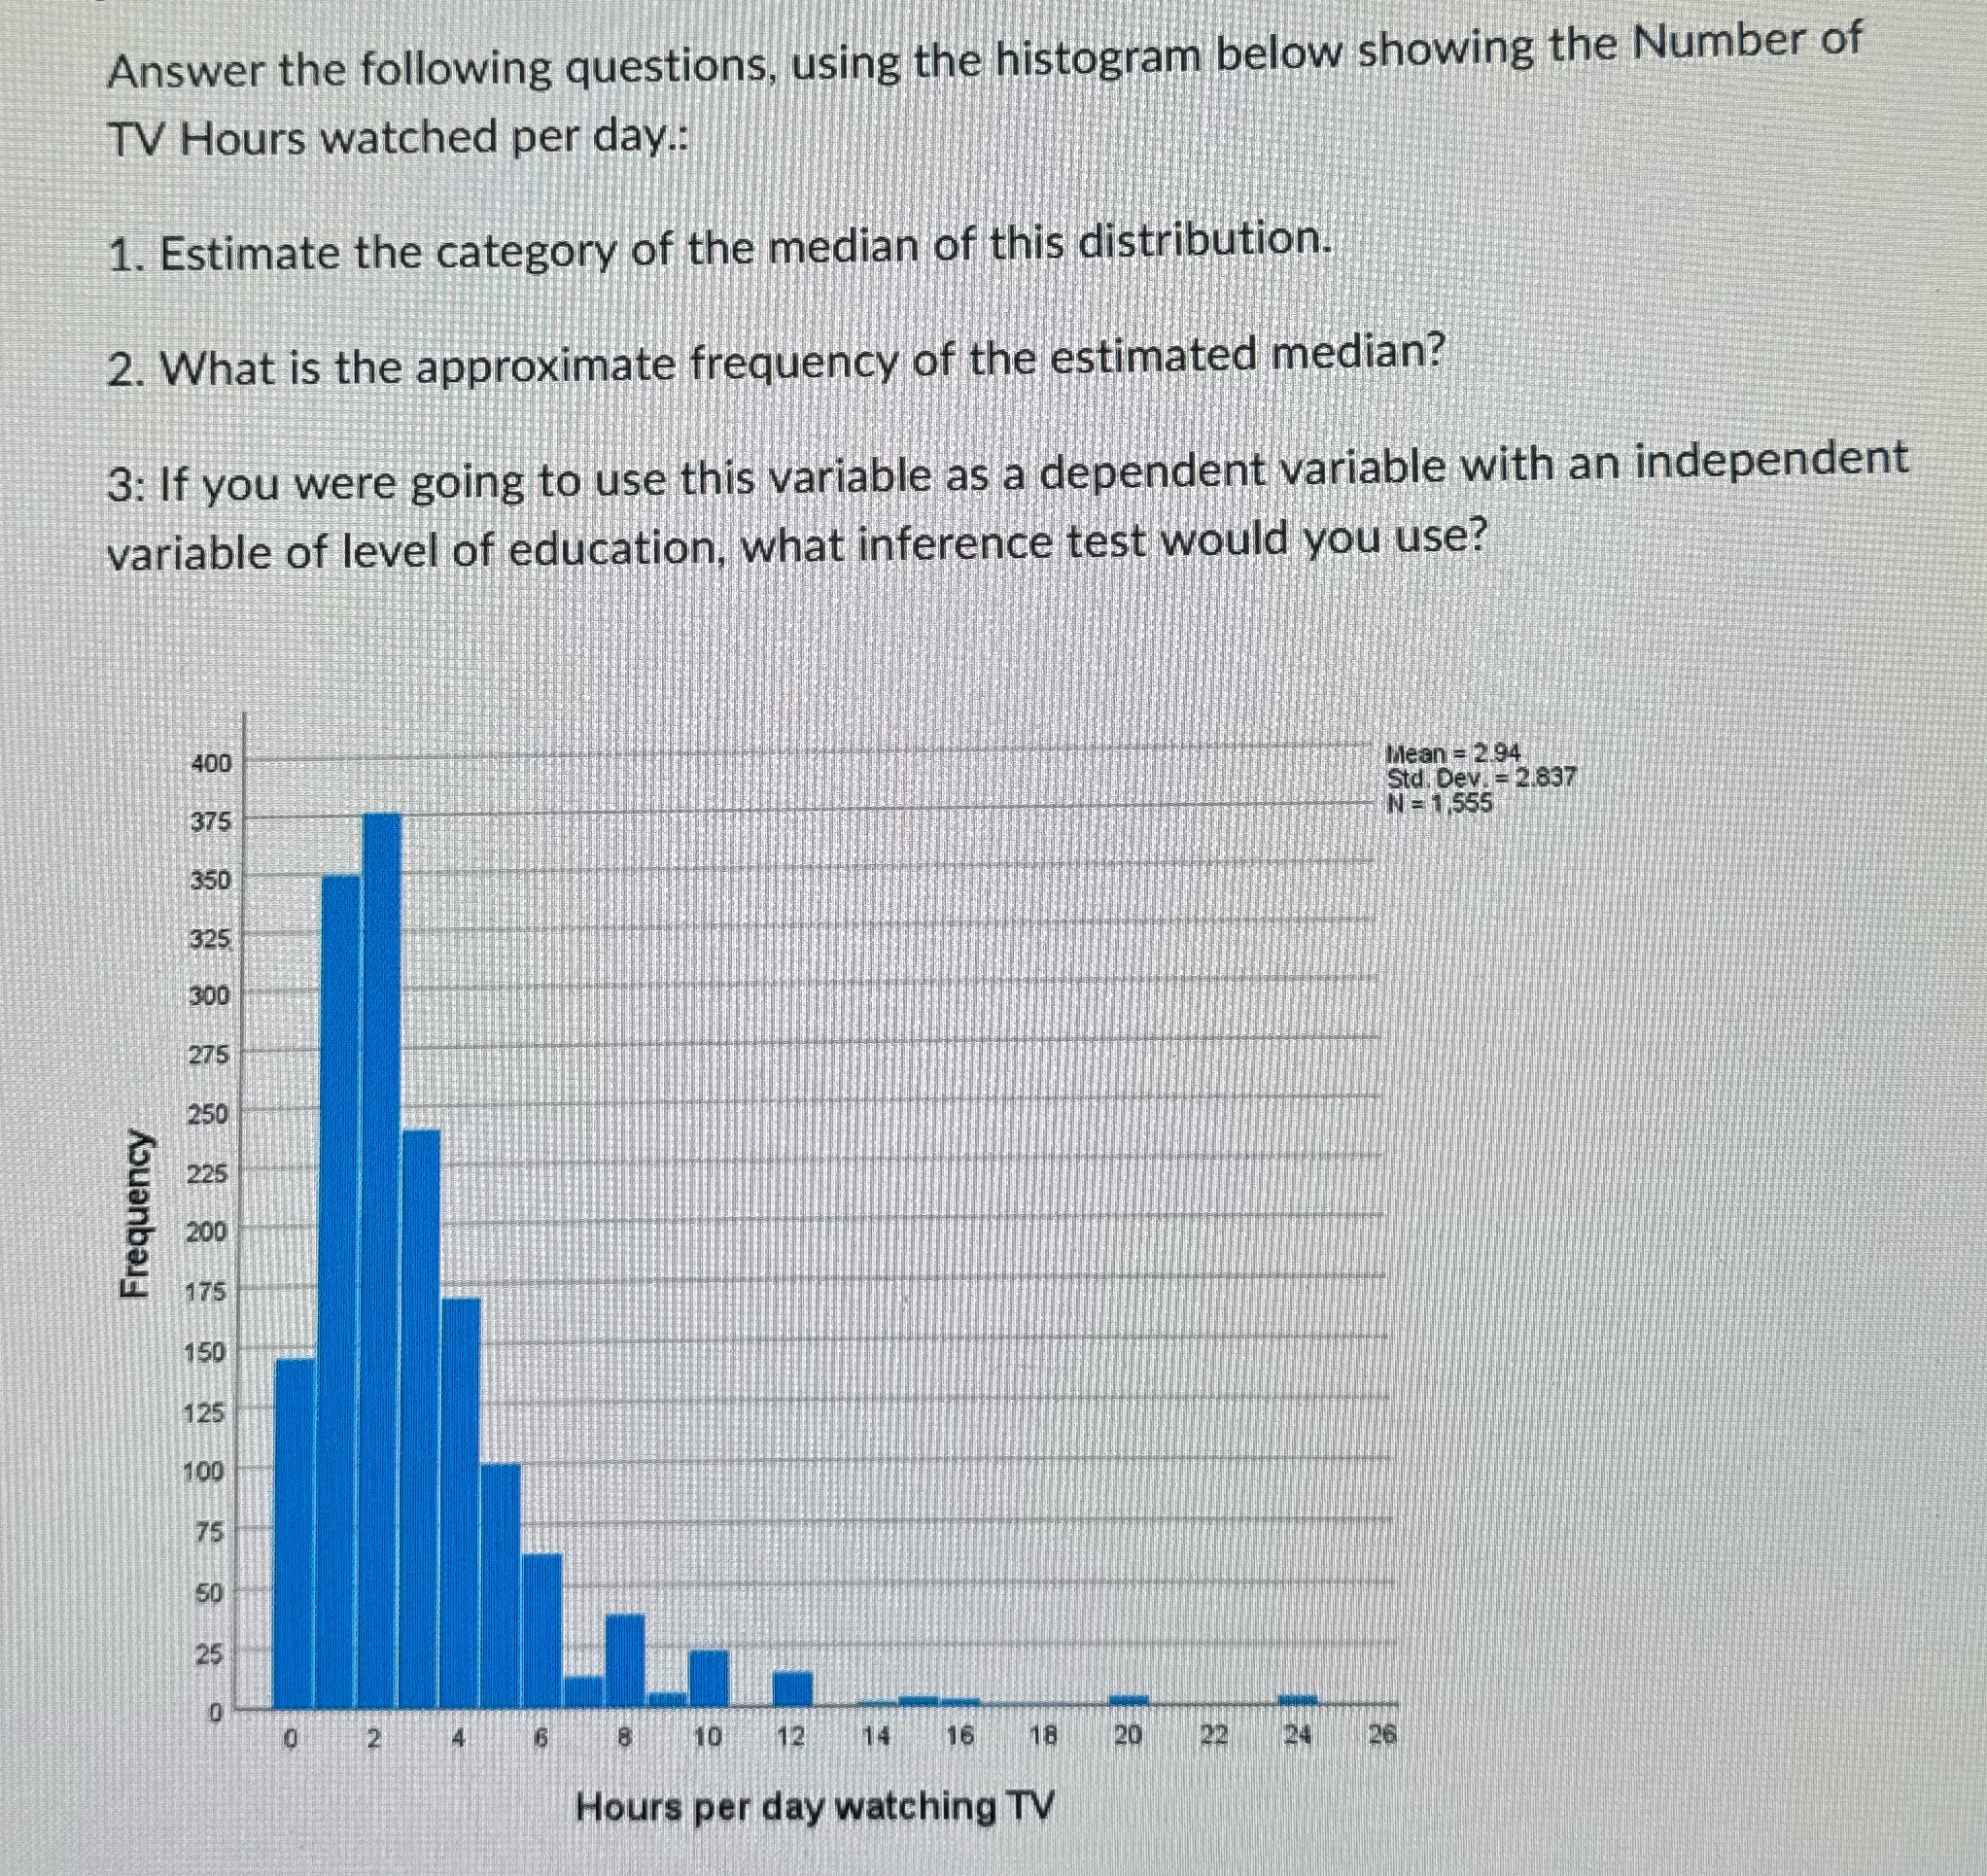
Answer the following questions, using the histogram below showing the Number of TV Hours watched per day.: 1. Estimate the category of the median of this distribution. 2. What is the approximate frequency of the estimated median? 3: If you were going to use this variable as a dependent variable with an independent variable of level of education, what inference test would you use? 400 Mean = 2.94 Std. Dev. = 2.837 375 N = 1,555 350 325 Frequency 25 2 8 10 12 14 16 18 20 22 24 26 Hours per day watching TV
Step by Step Solution
There are 3 Steps involved in it
1 Expert Approved Answer
Step: 1 Unlock

Question Has Been Solved by an Expert!
Get step-by-step solutions from verified subject matter experts
Step: 2 Unlock
Step: 3 Unlock