

Question: Answer the following two questions. 2. Which metrics does each company perform better on? 3. What supply chain drivers and metrics might explain this difference
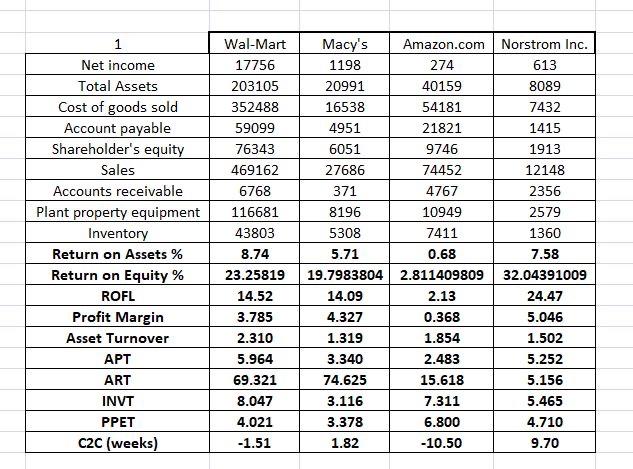
1 Net income Total Assets Cost of goods sold Account payable Shareholder's equity Sales Accounts receivable Plant property equipment Inventory Return on Assets % Return on Equity % ROFL Profit Margin Asset Turnover APT ART INVT PPET C2C (weeks) Wal-Mart 17756 203105 352488 59099 76343 469162 6768 116681 43803 8.74 23.25819 14.52 3.785 2.310 5.964 69.321 8.047 4.021 -1.51 Macy's Amazon.com Norstrom Inc. 1198 274 613 20991 40159 8089 16538 54181 7432 4951 21821 1415 6051 9746 1913 27686 74452 12148 371 4767 2356 8196 10949 2579 5308 7411 1360 5.71 0.68 7.58 19.7983804 2.811409809 32.04391009 14.09 2.13 24.47 4.327 0.368 5.046 1.319 1.854 1.502 3.340 2.483 5.252 74.625 15.618 5.156 3.116 7.311 5.465 3.378 6.800 4.710 1.82 -10.50 9.70
Step by Step Solution
There are 3 Steps involved in it

Get step-by-step solutions from verified subject matter experts