

Question: Answer the following using the given table below. Thanks! B. Given population 15, 12, 6, 9, and 17. Suppose samples of size 3 are drawn
Answer the following using the given table below. Thanks!
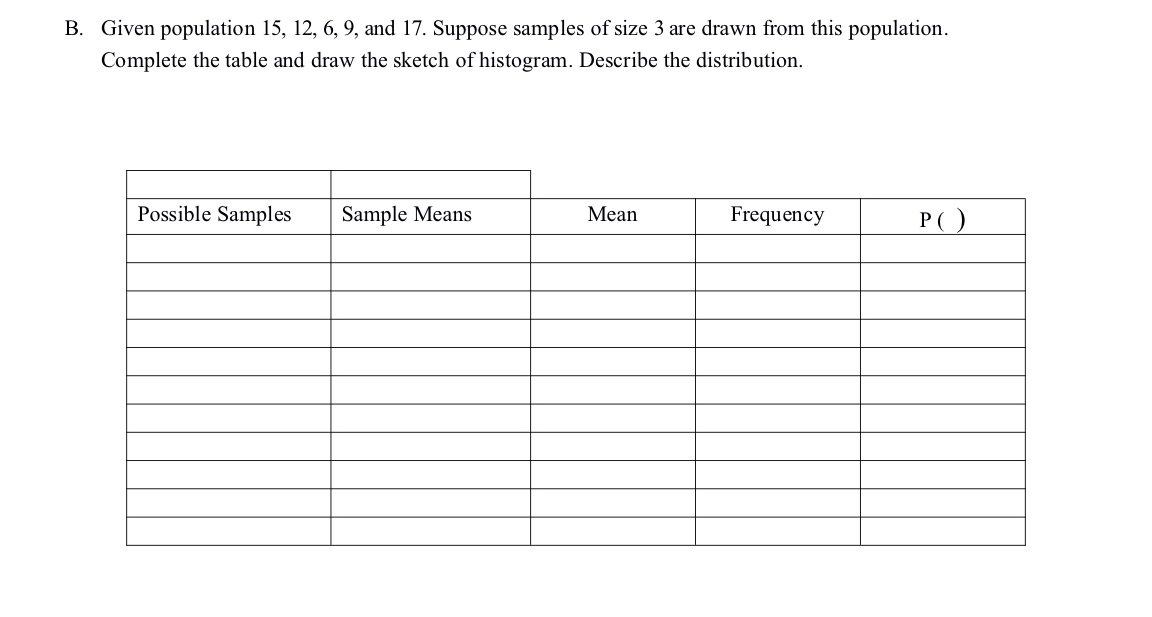
B. Given population 15, 12, 6, 9, and 17. Suppose samples of size 3 are drawn from this population. Complete the table and draw the sketch of histogram. Describe the distribution. Possible Samples Sample Means Mean Frequency P()
Step by Step Solution
There are 3 Steps involved in it
1 Expert Approved Answer
Step: 1 Unlock

Question Has Been Solved by an Expert!
Get step-by-step solutions from verified subject matter experts
Step: 2 Unlock
Step: 3 Unlock