

Question: Answer the following using the R statistical computing platform Consider the wine quality of young red wines data in Table B.19 below . Ignore regressor
Answer the following using the R statistical computing platform
Consider the wine quality of young red wines data in Table B.19 below. Ignore regressor x1. Perform a thorough residual analysis (standardized, PRESS, Rstudent, studentized) of these data. What conclusions do you draw from this analysis?
Include the following:
- Discussion of any outliers
- ANOVA table
- Residual plots of studentized residuals
- Statistical conclusions in full sentences keeping the context of the wine problem
Table B.19 and Chapter 4 link
https://documentcloud.adobe.com/link/track?uri=urn:aaid:scds:US:b9ede217-8d7f-47b0-af73-49e498154905
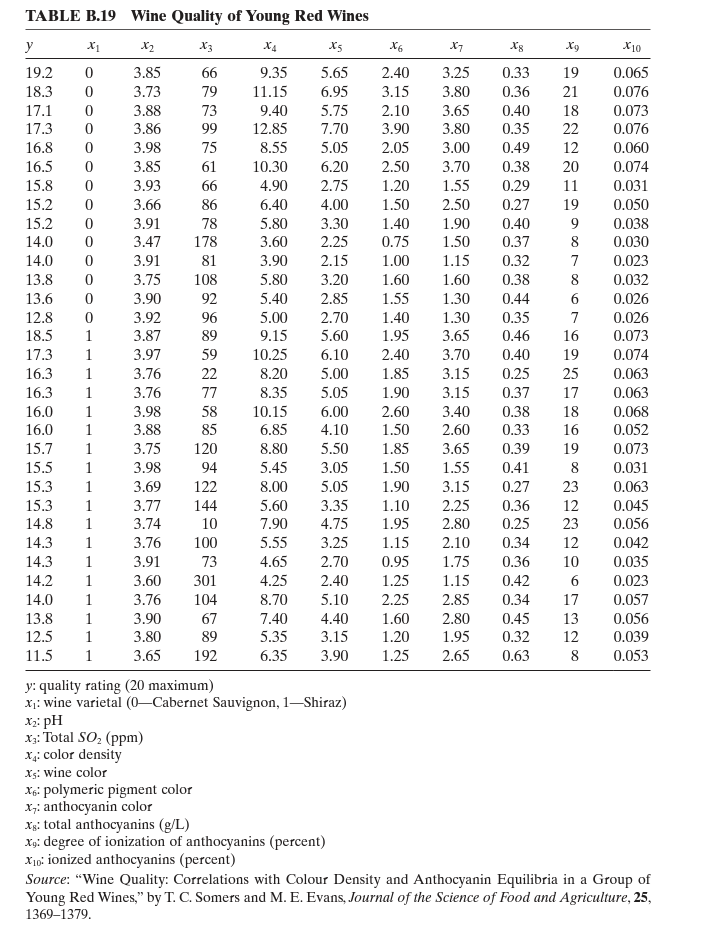
TABLE B.19 Wine Quality of Young Red Wines X1 X2 X3 X4 *'5 X 6 XT Xg X10 19.2 3.85 66 9.35 5.65 2.40 18.3 3.25 0.33 3.73 19 79 11.15 0.065 6.95 3.15 3.80 0.36 3.88 73 21 0.076 17.3 3.86 2.10 3.65 99 7.70 0.40 18 3.90 3.80 0.073 16.8 0.35 3.98 75 22 0.076 5.05 2.05 16.5 61 3.00 0.49 3.85 12 10.30 0.060 6.20 15.8 2.50 3.70 0.38 20 66 4.90 0.074 15.2 2.75 3.66 86 1.55 0.29 11 0.031 6.40 4.00 15.2 1.50 78 2.50 3.91 0.27 19 5.80 0.050 3.30 14.0 1.40 3.47 178 1.90 0.40 3.60 2.25 0.038 14.0 1.50 3.91 81 0.37 3.90 8 2.15 00 -J 0.030 13.8 1.00 3.75 0.32 108 5.80 3.20 1.60 13.6 1.60 3.90 92 0.032 2.85 12.8 1.55 3.92 96 0.44 18.5 89 2.70 0.026 3.87 1.40 9.15 1.30 0.35 5.60 0.026 3.65 0.46 16 0.073 10.25 6.10 22 2.40 16.3 3.76 3.70 19 8.20 0.074 5.00 1.85 16.3 3.15 3.76 77 0.25 25 8.35 5.05 0.063 16.0 3.98 58 3.15 0.37 17 10.15 0.063 6.00 16.0 85 2.60 3.88 3.40 18 6.85 4.10 0.068 1.50 2.60 0.33 8.80 16 120 0.052 15.5 3.65 0.39 94 19 5.45 0.073 1.50 1.55 0.41 8 3.69 122 8.00 0.031 15.3 1.90 3.77 3.15 144 0.27 23 5.60 14.8 3.35 0.063 1.10 3.74 2.25 7.90 0.36 10 4.75 12 0.045 3.76 1.95 0.25 100 5.55 23 0.056 3.25 2.10 3.91 73 4.65 12 2.70 0.042 0.95 14.2 1.75 0.36 3.60 301 10 0.035 14.0 2.40 3.76 1.15 104 8.70 0.42 5.10 0.023 13.8 2.25 2.85 0.34 17 67 7.40 0.057 4.40 12.5 1.60 3.80 89 2.80 0.45 13 0.056 5.35 3.15 3.65 0.32 192 6.35 12 0.039 3.90 1.25 2.65 0.63 8 0.053 y: quality rating (20 maximum) *: wine varietal (0-Cabernet Sauvignon, 1-Shiraz) X2: PH X3: Total SO2 (ppm) *4: color density X's: wine color * polymeric pigment color x7: anthocyanin color x's: total anthocyanins (@/L) Xy: degree of ionization of anthocyanins (percent) X10: ionized anthocyanins (percent) Source: "Wine Quality: Correlations with Colour Density and Anthocyanin Equilibria in a Group of 1369-1379. Young Red Wines," by T. C. Somers and M. E. Evans, Journal of the Science of Food and Agriculture, 25
Step by Step Solution
There are 3 Steps involved in it

Get step-by-step solutions from verified subject matter experts