Question:
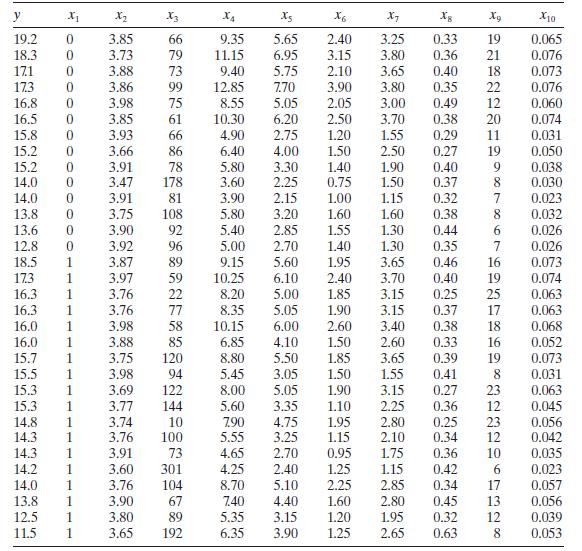
Consider the wine quality of young red wines data in Table B.19. For the purposes of this exercise, ignore regressor $x_{1}$. Perform a thorough analysis of these data. What conclusions do you draw from this analysis?
Transcribed Image Text:
y X2 X3 x4 X5 X6 X7 Xg X10 19.2 0 3.85 66 9.35 5.65 2.40 3.25 0.33 19 0.065 18.3 0 3.73 79 11.15 6.95 3.15 3.80 0.36 21 0.076 17.1 0 3.88 73 9.40 5.75 2.10 3.65 0.40 18 0.073 173 0 3.86 99 12.85 7.70 3.90 3.80 0.35 22 0.076 16.8 0 3.98 75 8.55 5.05 2.05 3.00 0.49 12 0.060 16.5 0 3.85 61 10.30 6.20 2.50 3.70 0.38 20 0.074 15.8 0 3.93 66 4.90 2.75 1.20 1.55 0.29 11 0.031 15.2 0 3.66 86 6.40 4.00 1.50 2.50 0.27 19 0.050 15.2 0 3.91 78 5.80 3.30 1.40 1.90 0.40 9 0.038 14.0 0 3.47 178 3.60 2.25 0.75 1.50 0.37 8 0.030 14.0 0 3.91 81 3.90 2.15 1.00 1.15 0.32 7 0.023 13.8 0 3.75 108 5.80 3.20 1.60 1.60 0.38 8 0.032 13.6 0 3.90 92 5.40 2.85 1.55 1.30 0.44 6 0.026 12.8 0 3.92 96 5.00 2.70 1.40 1.30 0.35 7 0.026 18.5 1 3.87 89 9.15 5.60 1.95 3.65 0.46 16 0.073 173 1 3.97 59 10.25 6.10 2.40 3.70 0.40 19 0.074 16.3 1 3.76 22 8.20 5.00 1.85 3.15 0.25 25 0.063 16.3 1 3.76 77 8.35 5.05 1.90 3.15 0.37 17 0.063 16.0 1 3.98 58 10.15 6.00 2.60 3.40 0.38 18 0.068 16.0 1 3.88 85 6.85 4.10 1.50 2.60 0.33 16 0.052 15.7 1 3.75 120 8.80 5.50 1.85 3.65 0.39 19 0.073 15.5 1 3.98 94 5.45 3.05 1.50 1.55 0.41 8 0.031 15.3 1 3.69 122 8.00 5.05 1.90 3.15 0.27 23 0.063 15.3 1 3.77 144 5.60 3.35 1.10 2.25 0.36 12 0.045 14.8 1 3.74 10 7.90 4.75 1.95 2.80 0.25 23 0.056 14.3 1 3.76 100 5.55 3.25 1.15 2.10 0.34 12 0.042 14.3 1 3.91 73 4.65 2.70 0.95 1.75 0.36 10 0.035 14.2 1 3.60 301 4.25 2.40 1.25 1.15 0.42 6 0.023 14.0 1 3.76 104 8.70 5.10 2.25 2.85 0.34 17 0.057 13.8 1 3.90 67 7.40 4.40 1.60 2.80 0.45 13 0.056 12.5 1 3.80 89 5.35 3.15 1.20 1.95 0.32 12 0.039 11.5 1 3.65 192 6.35 3.90 1.25 2.65 0.63 8 0.053


