

Question: answer the problem. 59.8 65.3 68.4 55 69.9 65 62.5 54 65.1 64.9 63.8 63.6 67 60 66.6 66.1 48.4 73.8 63.8 69.7 63.5 52.9
answer the problem.
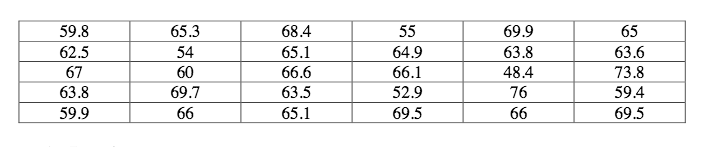
59.8 65.3 68.4 55 69.9 65 62.5 54 65.1 64.9 63.8 63.6 67 60 66.6 66.1 48.4 73.8 63.8 69.7 63.5 52.9 76 59.4 59.9 66 65.1 69.5 66 69.57. Probability of observing the sample proportion: Ifthe true population proportion of those speeding is hypothesized to be {1.6: a. (5 points} Draw and label a diagram of the normal curve that shows the hypothesized population proportion1 the sample proportion you calculated above and shade in the probability of seeing that sample proportion or more
Step by Step Solution
There are 3 Steps involved in it
1 Expert Approved Answer
Step: 1 Unlock

Question Has Been Solved by an Expert!
Get step-by-step solutions from verified subject matter experts
Step: 2 Unlock
Step: 3 Unlock