

Question: answer the problem. 59.8 65.3 68.4 55 69.9 65 62.5 54 65.1 64.9 63.8 63.6 67 60 66.6 66.1 48.4 73.8 63.8 69.7 63.5 52.9
answer the problem.
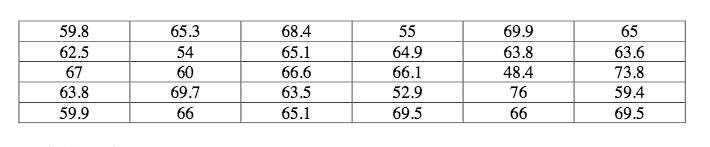
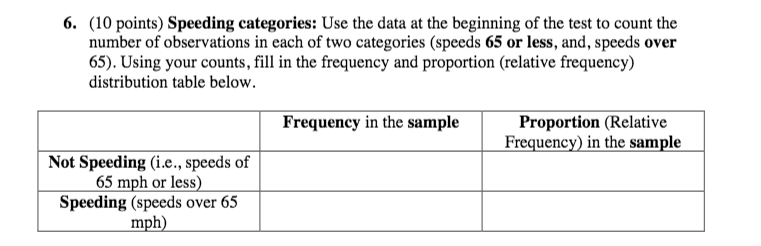
59.8 65.3 68.4 55 69.9 65 62.5 54 65.1 64.9 63.8 63.6 67 60 66.6 66.1 48.4 73.8 63.8 69.7 63.5 52.9 76 59.4 59.9 66 65.1 69.5 66 69.56. (10 points) Speeding categories: Use the data at the beginning of the test to count the number of observations in each of two categories (speeds 65 or less, and, speeds over 65). Using your counts, fill in the frequency and proportion (relative frequency) distribution table below. Frequency in the sample Proportion (Relative Frequency) in the sample Not Speeding (i.e., speeds of 65 mph or less) Speeding (speeds over 65 mph)
Step by Step Solution
There are 3 Steps involved in it
1 Expert Approved Answer
Step: 1 Unlock

Question Has Been Solved by an Expert!
Get step-by-step solutions from verified subject matter experts
Step: 2 Unlock
Step: 3 Unlock