

Question: Answer the question below: 1. The following graph is Andy's Engle curve for rice. Indicate on the graph the income levels where rice is an
Answer the question below:
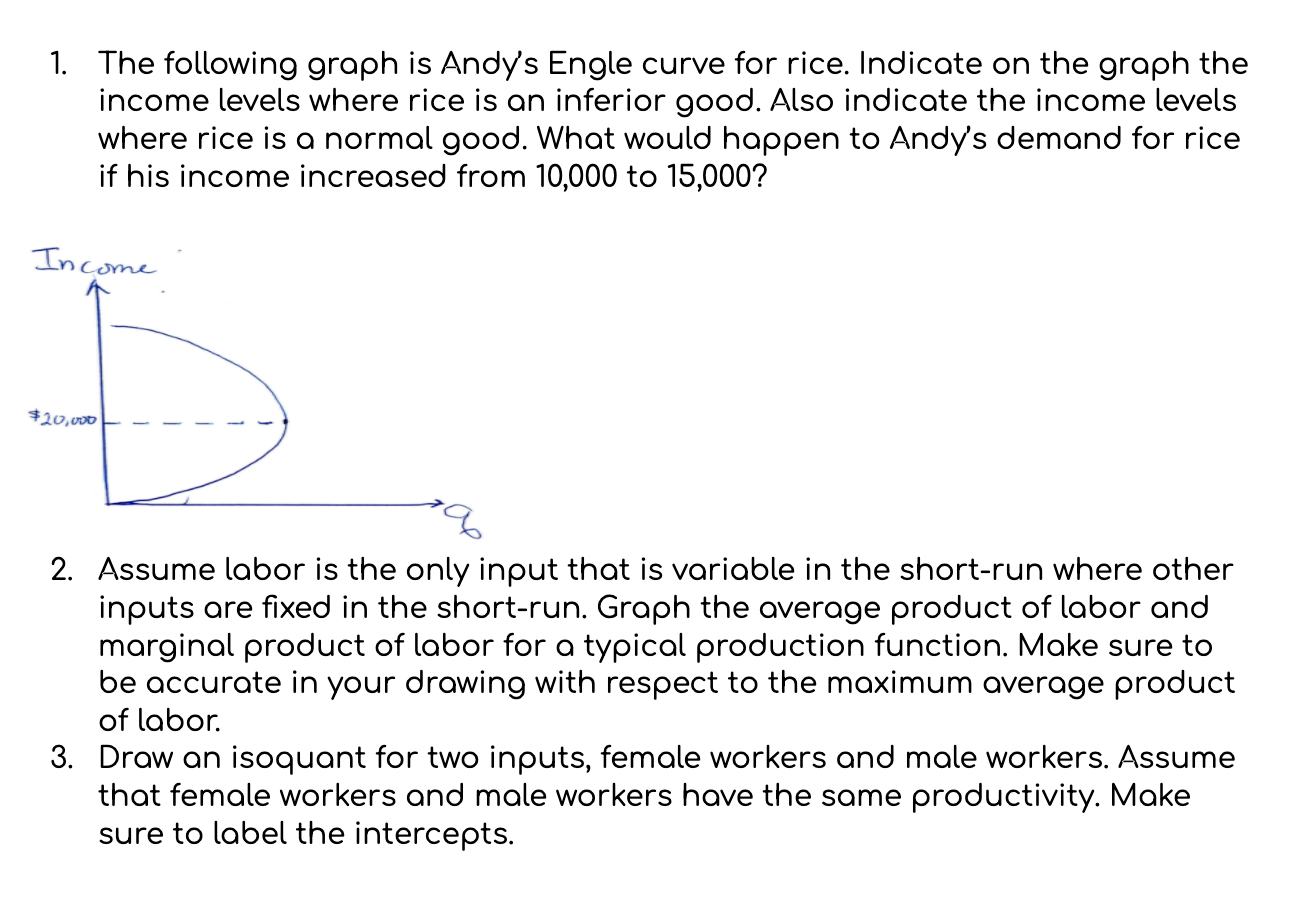
1. The following graph is Andy's Engle curve for rice. Indicate on the graph the income levels where rice is an inferior good. Also indicate the income levels where rice is a normal good. What would happen to Andy's demand for rice if his income increased from 10,000 to 15,000? Income $20,000 2. Assume labor is the only input that is variable in the short-run where other inputs are fixed in the short-run. Graph the average product of labor and marginal product of labor for a typical production function. Make sure to be accurate in your drawing with respect to the maximum average product of labor. 3. Draw an isoquant for two inputs, female workers and male workers. Assume that female workers and male workers have the same productivity. Make sure to label the intercepts
Step by Step Solution
There are 3 Steps involved in it

Get step-by-step solutions from verified subject matter experts