

Question: answer the question quickly for thumbs up 1.2.9. The technique of cobwebbing to study iterated models is not limited to just logistic growth. Graphically determine
answer the question quickly for thumbs up
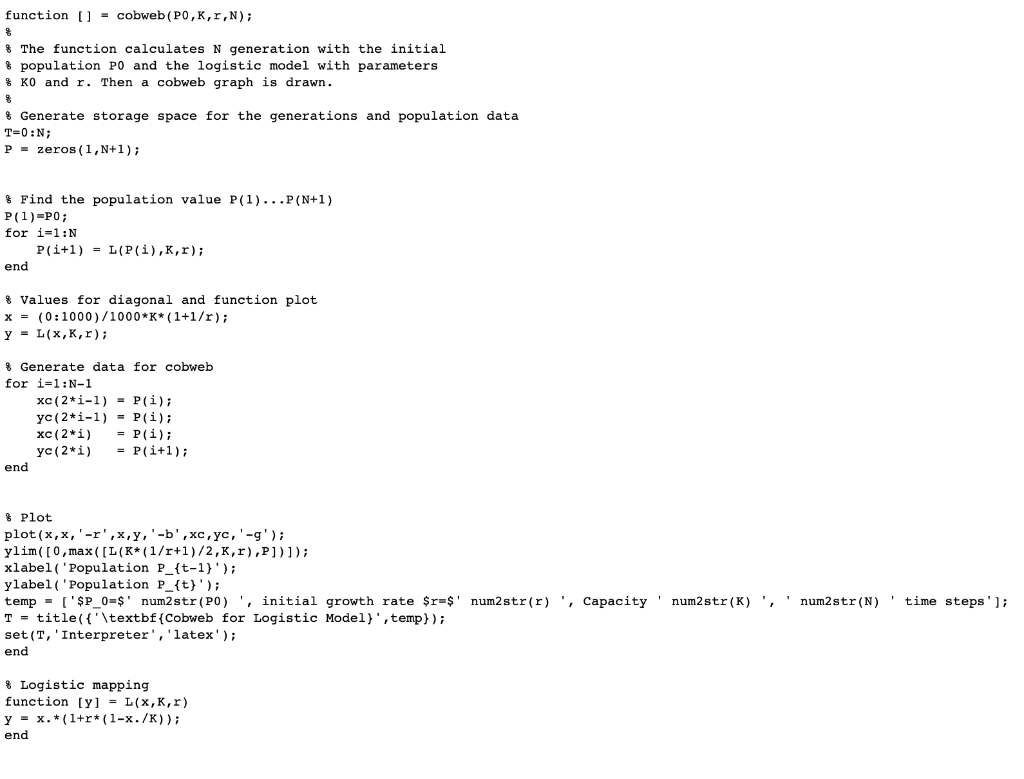
1.2.9. The technique of cobwebbing to study iterated models is not limited to just logistic growth. Graphically determine the populations for the next six time increments in each of the models of Figure 1.5 using the initial populations shown. function () = cobweb (PO,K,r,N); & The function calculates N generation with the initial & population PO and the logistic model with parameters # KO and r. Then a cobweb graph is drawn. & Generate storage space for the generations and population data | T=0;N; P = zeros (1,N+1); & Find the population value P(1)...P(N+1) P(1)=P0; for i=1:N P(i+1) = L(P(i),K,r); end % Values for diagonal and function plot x = (0:1000)/1000*K*(1+1/r); y = L(x,K,r); % Generate data for cobweb for i=1:N-1 xc(2*i-1) = P(i); yc(2*i-1) = P(i); xc(2*i) = P(i); yc(2*i) = P(i+1); end % Plot plot(x,x,'-r',x,y,'-b',c, yc,'-'); ylim( [0,max( [L(K*(1/r+1)/2,K,r),P])]); xlabel('Population P_{t-1}'); ylabel('Population P_{t}'); temp = ('$P_0=$' num2 str(PO)', initial growth rate $r=$' num2 str(r)', Capacity' num2 str(K)', ' num2 str(N)' time steps' ); T-title({'\textbf{Cobweb for Logistic Model}', temp} ); set (T, 'Interpreter', 'latex'); end & Logistic mapping function [y] = L(x,K,r) y = x.*(1+r*(1-x./K)); end 1.2.9. The technique of cobwebbing to study iterated models is not limited to just logistic growth. Graphically determine the populations for the next six time increments in each of the models of Figure 1.5 using the initial populations shown. function () = cobweb (PO,K,r,N); & The function calculates N generation with the initial & population PO and the logistic model with parameters # KO and r. Then a cobweb graph is drawn. & Generate storage space for the generations and population data | T=0;N; P = zeros (1,N+1); & Find the population value P(1)...P(N+1) P(1)=P0; for i=1:N P(i+1) = L(P(i),K,r); end % Values for diagonal and function plot x = (0:1000)/1000*K*(1+1/r); y = L(x,K,r); % Generate data for cobweb for i=1:N-1 xc(2*i-1) = P(i); yc(2*i-1) = P(i); xc(2*i) = P(i); yc(2*i) = P(i+1); end % Plot plot(x,x,'-r',x,y,'-b',c, yc,'-'); ylim( [0,max( [L(K*(1/r+1)/2,K,r),P])]); xlabel('Population P_{t-1}'); ylabel('Population P_{t}'); temp = ('$P_0=$' num2 str(PO)', initial growth rate $r=$' num2 str(r)', Capacity' num2 str(K)', ' num2 str(N)' time steps' ); T-title({'\textbf{Cobweb for Logistic Model}', temp} ); set (T, 'Interpreter', 'latex'); end & Logistic mapping function [y] = L(x,K,r) y = x.*(1+r*(1-x./K)); end
Step by Step Solution
There are 3 Steps involved in it

Get step-by-step solutions from verified subject matter experts